

The Journal of Practical Medicine ›› 2026, Vol. 42 ›› Issue (15): 2847-2852.doi: 10.3969/j.issn.1006-5725.2026.15.022
• Treatise:Mechanism and Practice • Previous Articles
Zihua WANG1,2,Hongzhen WU3,Junjie TAN1,2,Xuewei ZENG1,2( )
)
Received:2026-05-18
Revised:2026-06-11
Accepted:2026-06-16
Online:2026-08-10
Published:2026-08-13
Contact:
Xuewei ZENG
E-mail:81842829@qq.com
CLC Number:
Zihua WANG,Hongzhen WU,Junjie TAN,Xuewei ZENG. Spatial distribution characteristics of liver fat content evaluated by magnetic resonance imaging proton density fat fraction[J]. The Journal of Practical Medicine, 2026, 42(15): 2847-2852.
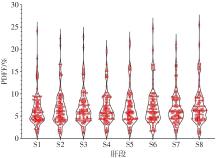
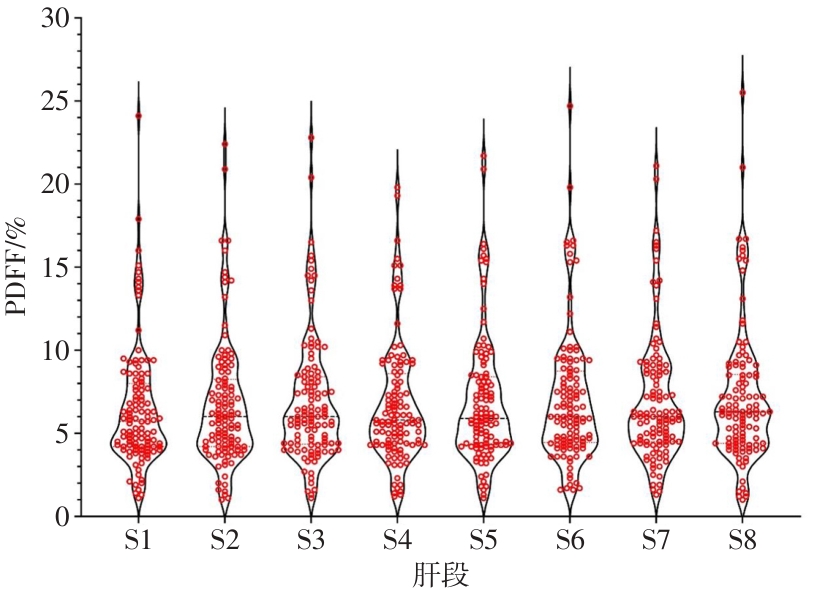
Fig.1
Distribution of proton density fat fraction in each liver segment"
Tab.1
Comparison of proton density fat fraction among liver segments and liver lobes"
| 组别 | PDFF/% | χ2值 | P值 |
|---|---|---|---|
| 肝段 | - | 78.865 | < 0.001 |
| S1 | 5.70(4.20,7.90) | ||
| S2 | 6.00(4.20,8.20) | ||
| S3 | 6.00(4.40,8.40) | ||
| S4 | 5.80(4.40,8.50) | ||
| S5 | 5.90(4.30,8.40) | ||
| S6 | 6.00(4.50,8.70) | ||
| S7 | 6.00(4.50,8.70) | ||
| S8 | 6.30(4.40,8.50) | ||
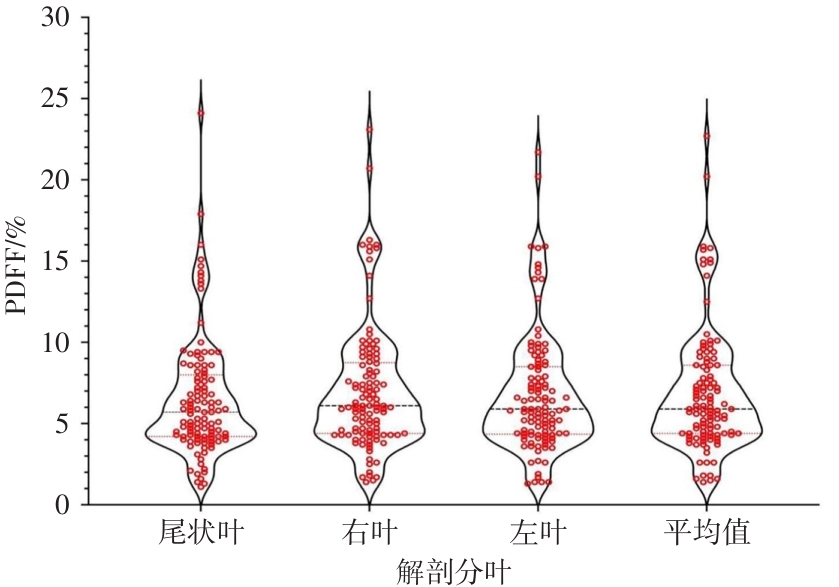
| 肝叶 | - | 103.249 | < 0.001 |
| 尾状叶 | 5.70(4.20,7.90) | ||
| 右叶 | 6.10(4.40,8.70) | ||
| 左叶 | 5.90(4.40,8.50) | ||
| 全肝 | 5.90(4.40,8.60) |
Tab.2
Pairwise comparison of proton density fat fraction among different liver segments"
| 组别 | 差值 | 标准误 | Z值 | P值 | 校正后P值 |
|---|---|---|---|---|---|
| S1 ~ S2 | -1.035 | 0.326 | -3.177 | 0.001 | 0.042 |
| S1 ~ S3 | -1.615 | 0.326 | -4.956 | < 0.001 | < 0.001 |
| S1 ~ S4 | -1.080 | 0.326 | -3.313 | 0.001 | 0.026 |
| S1 ~ S5 | -1.469 | 0.326 | -4.508 | < 0.001 | < 0.001 |
| S1 ~ S6 | -2.088 | 0.326 | -6.409 | < 0.001 | < 0.001 |
| S1 ~ S7 | -2.137 | 0.326 | -6.558 | < 0.001 | < 0.001 |
| S1 ~ S8 | -2.327 | 0.326 | -7.142 | < 0.001 | < 0.001 |
| S2 ~ S3 | -0.580 | 0.326 | -1.779 | 0.075 | 1.000 |
| S2 ~ S4 | -0.044 | 0.326 | -0.136 | 0.892 | 1.000 |
| S2 ~ S5 | -0.434 | 0.326 | -1.331 | 0.183 | 1.000 |
| S2 ~ S6 | -1.053 | 0.326 | -3.232 | 0.001 | 0.034 |
| S2 ~ S7 | -1.102 | 0.326 | -3.381 | 0.001 | 0.020 |
| S2 ~ S8 | -1.292 | 0.326 | -3.965 | < 0.001 | 0.002 |
| S4 ~ S5 | -0.389 | 0.326 | -1.195 | 0.232 | 1.000 |
| S4 ~ S3 | 0.535 | 0.326 | 1.643 | 0.100 | 1.000 |
| S4 ~ S6 | -1.009 | 0.326 | -3.096 | 0.002 | 0.055 |
| S4 ~ S7 | -1.058 | 0.326 | -3.245 | 0.001 | 0.033 |
| S4 ~ S8 | -1.248 | 0.326 | -3.829 | < 0.001 | 0.004 |
| S5 ~ S3 | 0.146 | 0.326 | 0.448 | 0.654 | 1.000 |
| S5 ~ S6 | -0.619 | 0.326 | -1.901 | 0.057 | 1.000 |
| S5 ~ S7 | -0.668 | 0.326 | -2.050 | 0.040 | 1.000 |
| S5 ~ S8 | -0.858 | 0.326 | -2.634 | 0.008 | 0.236 |
| S3 ~ S6 | -0.473 | 0.326 | -1.453 | 0.146 | 1.000 |
| S3 ~ S7 | -0.522 | 0.326 | -1.602 | 0.109 | 1.000 |
| S3 ~ S8 | -0.712 | 0.326 | -2.186 | 0.029 | 0.807 |
| S6 ~ S7 | -0.049 | 0.326 | -0.149 | 0.881 | 1.000 |
| S6 ~ S8 | -0.239 | 0.326 | -0.733 | 0.463 | 1.000 |
| S7 ~ S8 | -0.190 | 0.326 | -0.584 | 0.559 | 1.000 |
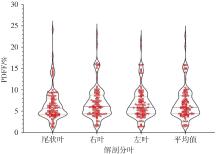
Fig.2
Distribution of proton density fat fraction in each liver lobe"
Tab.3
Pairwise comparison of proton density fat fraction among liver lobes"
| 组别 | 差值 | 标准误 | Z值 | P值 | 校正后P值 |
|---|---|---|---|---|---|
| 尾状叶-左叶 | -0.774 | 0.172 | -4.508 | < 0.001 | < 0.001 |
| 尾状叶-右叶 | -1.642 | 0.172 | -9.558 | < 0.001 | < 0.001 |
| 尾状叶-全肝 | -1.018 | 0.172 | -5.925 | < 0.001 | < 0.001 |
| 左叶-全肝 | -0.243 | 0.172 | -1.417 | 0.156 | 0.939 |
| 左叶-右叶 | 0.867 | 0.172 | 5.049 | < 0.001 | < 0.001 |
| 右叶-全肝 | 0.624 | 0.172 | 3.633 | < 0.001 | 0.002 |
Tab.4
Correlation between whole-liver proton density fat fraction and various biochemical indicators"
| 生化指标 | 百分位数 | 相关系数 | P值 | ||
|---|---|---|---|---|---|
| P25 | P50 | P75 | |||
| 全肝PDFF/% | 4.36 | 5.89 | 8.58 | - | - |
| 年龄/岁 | 48.00 | 57.00 | 67.00 | -0.096 | 0.311 |
| 谷草转氨酶/(U/L) | 34.50 | 48.00 | 62.00 | -0.032 | 0.737 |
| 谷丙转氨酶/(U/L) | 29.50 | 42.00 | 67.00 | 0.164 | 0.082 |
| 碱性磷酸酶/(U/L) | 89.00 | 141.00 | 224.50 | 0.017 | 0.859 |
| γ-谷氨酰基转移酶/(U/L) | 91.00 | 148.00 | 224.00 | 0.029 | 0.761 |
| 总胆红素/(μmol/L) | 29.15 | 49.40 | 89.70 | -0.009 | 0.922 |
| 白蛋白/(g/L) | 31.75 | 37.60 | 41.95 | -0.105 | 0.27 |
| 糖化血红蛋白/% | 5.40 | 6.00 | 6.60 | 0.21 | 0.026 |
| 总胆固醇/(mmol/L) | 2.41 | 3.83 | 5.25 | 0.159 | 0.092 |
| 甘油三酯/(mmol/L) | 0.85 | 1.42 | 2.08 | 0.243 | 0.01 |
| 高密度脂蛋白胆固醇/(mmol/L) | 0.93 | 1.12 | 1.33 | 0.023 | 0.81 |
| 低密度脂蛋白胆固醇/(mmol/L) | 1.97 | 2.76 | 3.56 | 0.155 | 0.101 |
| 载脂蛋白A/(g/L) | 1.23 | 1.58 | 1.87 | -0.192 | 0.042 |
| 载脂蛋白B/(g/L) | 1.14 | 1.38 | 1.84 | -0.07 | 0.461 |
| 脂蛋白(a)/(mg/L) | 77.75 | 178.12 | 255.84 | 0.106 | 0.266 |
| 血小板计数/(×109/L) | 149.00 | 199.00 | 256.00 | 0.056 | 0.554 |
| 白细胞/(×109/L) | 5.49 | 6.78 | 8.55 | -0.137 | 0.148 |
| 血尿酸/(μmol/L) | 371.00 | 431.00 | 518.50 | 0.031 | 0.748 |
| 凝血酶原时间/s | 13.50 | 14.10 | 14.65 | -0.027 | 0.779 |
| 甲胎蛋白/(ng/mL) | 4.56 | 8.57 | 142.00 | -0.073 | 0.443 |
| [1] |
YOUNOSSI Z M, GOLABI P, PAIK J M, et al. The global epidemiology of nonalcoholic fatty liver disease (NAFLD) and nonalcoholic steatohepatitis (NASH): A systematic review[J]. Hepatology, 2023, 77(4): 1335-1347. doi:10.1097/HEP. 0000000000000004 .
doi: 10.1097/HEP. 0000000000000004 |
| [2] |
RIAZI K, AZHARI H, CHARETTE J H, et al. The prevalence and incidence of NAFLD worldwide: A systematic review and meta-analysis[J]. Lancet Gastroenterol Hepatol, 2022, 7(9): 851-861. doi:10.1016/S2468-1253(22)00165-0 .
doi: 10.1016/S2468-1253(22)00165-0 |
| [3] |
LATIF S, AHSAN T. Prevalence of metabolic dysfunction-associated steatotic liver disease (MASLD) in persons with obesity and type 2 diabetes mellitus: A cross-sectional study[J]. Eurasian J Hepato Gastroenterol, 2024, 14(2): 129-133. doi:10.5005/jp-journals-10018-1437 .
doi: 10.5005/jp-journals-10018-1437 |
| [4] |
HUANG D Q, EL-SERAG H B, LOOMBA R. Global epidemiology of NAFLD-related HCC: Trends, predictions, risk factors and prevention[J]. Nat Rev Gastroenterol Hepatol, 2021, 18(4): 223-238. doi:10.1038/s41575-020-00381-6 .
doi: 10.1038/s41575-020-00381-6 |
| [5] |
LIU X R, YIN S C, CHEN Y T, et al. Metabolic dysfunction-associated steatotic liver disease and its associated health risks[J]. J Chin Med Assoc, 2025, 88(5): 343-351. doi:10.1097/jcma.0000000000001230 .
doi: 10.1097/jcma.0000000000001230 |
| [6] |
LOOMBA R, FRIEDMAN S L, SHULMAN G I. Mechanisms and disease consequences of nonalcoholic fatty liver disease[J]. Cell, 2021, 184(10): 2537-2564. doi:10.1016/j.cell.2021.04.015 .
doi: 10.1016/j.cell.2021.04.015 |
| [7] |
杨晨, 余上海, 徐飞鹏, 等. 磁共振质子密度脂肪分数(MRI-PDFF)在肝脂肪定量中的应用[J]. 临床肝胆病杂志, 2024, 40(3): 600-605. doi:10.12449/JCH240327 .
doi: 10.12449/JCH240327 |
| [8] |
STAREKOVA J, WEINGÄRTNER S, RUTKOWSKI D R, et al. Cross-vendor validation of proton density fat fraction and T1 mapping using a combined proton density fat fraction—T1 phantom[J]. J Magn Reson Imag, 2026. doi: 10.1002/jmri.70344 .
doi: 10.1002/jmri.70344 |
| [9] |
马雪颖, 马向明. 非酒精性脂肪肝患者肝脏纤维化血清学测评方法的研究进展[J]. 实用医学杂志, 2025, 41(15): 2290-2303. doi:10.3969/j.issn.1006-5725.2025.15.002 .
doi: 10.3969/j.issn.1006-5725.2025.15.002 |
| [10] |
TAMAKI N, AJMERA V, LOOMBA R. Non-invasive methods for imaging hepatic steatosis and their clinical importance in NAFLD[J]. Nat Rev Endocrinol, 2022, 18(1): 55-66. doi:10.1038/s41574-021-00584-0 .
doi: 10.1038/s41574-021-00584-0 |
| [11] |
HUA B, HAKKARAINEN A, ZHOU Y, et al. Fat accumulates preferentially in the right rather than the left liver lobe in non-diabetic subjects[J]. Dig Liver Dis, 2018, 50(2): 168-174. doi:10.1016/j.dld.2017.08.030 .
doi: 10.1016/j.dld.2017.08.030 |
| [12] |
WU X, XIAO H, MA L. The application of computational fluid dynamics in hepatic portal vein haemodynamics research: A narrative review[J]. Quant Imaging Med Surg, 2025, 15(3): 2605-2620. doi:10.21037/qims-24-1593 .
doi: 10.21037/qims-24-1593 |
| [13] |
CARLI F, DELLA PEPA G, SABATINI S, et al. Lipid metabolism in MASLD and MASH: From mechanism to the clinic[J]. JHEP Rep, 2024, 6(12): 101185. doi:10.1016/j.jhepr.2024. 101185 .
doi: 10.1016/j.jhepr.2024. 101185 |
| [14] |
WANG L Z, LI W Q, LI Y, et al. Assessing the impact of liver fat fraction on portal hemodynamics in nonalcoholic fatty liver disease using MRI proton density fat fraction and MRI 4D Flow[J]. Front Med, 2025, 12: 1620649. doi:10.3389/fmed.2025. 1620649 .
doi: 10.3389/fmed.2025. 1620649 |
| [15] |
WANG J, LI X, MA M, et al. Monte Carlo modeling of hepatic steatosis based on stereology and spatial distribution of fat droplets[J]. Comput Meth Programs Biomed, 2023, 233: 107494. doi:10.1016/j.cmpb.2023.107494 .
doi: 10.1016/j.cmpb.2023.107494 |
| [16] |
BO T, GAO L, YAO Z, et al. Hepatic selective insulin resistance at the intersection of insulin signaling and metabolic dysfunction-associated steatotic liver disease[J]. Cell Metab, 2024, 36(5): 947-968. doi:10.1016/j.cmet.2024.04.006 .
doi: 10.1016/j.cmet.2024.04.006 |
| [17] |
万艳, 常剑波, 白艳霞, 等. 血清学指标在非酒精性脂肪性肝病诊断中的意义[J]. 临床肝胆病杂志, 2017, 33(5): 963-968. doi:10.3969/j.issn.1001-5256.2017.05.037 .
doi: 10.3969/j.issn.1001-5256.2017.05.037 |
| [18] |
SCODITTI E, MARCHESINI G, GASTALDELLI A. Hunting for progressive NAFLD in type 2 diabetes: Do not trust liver enzymes![J]. Diabetes Care, 2023, 46(7): 1332-1334. doi:10.2337/dci23-0027 .
doi: 10.2337/dci23-0027 |
| [19] |
PIRIMOĞLU B, SADE R, POLAT G, et al. Analysis of correlation between liver fat fraction and AST and ALT levels in overweight and obese children by using new magnetic resonance imaging technique[J]. Turk J Gastroenterol, 2020, 31(2): 156-162. doi:10.5152/tjg.2020.18594 .
doi: 10.5152/tjg.2020.18594 |
| [20] |
DAG N, BILALOĞLU M K, KUTLU R. Comparison of manual multi-ROI, single-location, and volumetric fat fraction measurements for hepatic steatosis using MRI[J]. Diagnostics, 2026, 16(5): 716. doi:10.3390/diagnostics16050716 .
doi: 10.3390/diagnostics16050716 |
| [21] |
BRIL F, BARB D, PORTILLO-SANCHEZ P, et al. Metabolic and histological implications of intrahepatic triglyceride content in nonalcoholic fatty liver disease[J]. Hepatology, 2017, 65(4): 1132-1144. doi:10.1002/hep.28985 .
doi: 10.1002/hep.28985 |
| [1] | Kai LI,Xing WANG,Zhijun ZENG,Xu CHENG,Bo SHI. Application and imaging characteristics of transrectal real-time tissue elastography combined with MRI in the diagnosis of benign and malignant prostate lesions [J]. The Journal of Practical Medicine, 2026, 42(6): 1070-1077. |
| [2] | Yang OU,Shouzhu XU,Siyao ZENG,Jiebing HE,Sijia GUO,Yang ZHOU,Xiaoming CHEN. Resting-sate functional magnetic resonance imaging brain functional connectivity analysis in cognitive impairment of hypoxia-related diseases: A review [J]. The Journal of Practical Medicine, 2026, 42(6): 1097-1104. |
| [3] | Weiqiang TAN,Li LIU,Xudong LIU,Yehuang WEI,Xiaoqian GONG,Rongrong WANG. The effect of the Qushi Huoxue decoction on the AMPK/SREBP1c signaling pathway in free fatty acid-induced HepG2 cells [J]. The Journal of Practical Medicine, 2026, 42(3): 406-415. |
| [4] | Lili FAN,Hongmin LI,Kan ZHOU,Bo XU. Analysis of the diagnostic efficacy of fat liver index in the screening of metabolic dysfunction-related fatty liver diseases [J]. The Journal of Practical Medicine, 2026, 42(3): 416-424. |
| [5] | Ying FENG,Saiqun LV,Xiaohui ZENG,Tao PENG. Association between CT-quantified body composition and severity of metabolic associated fatty liver disease [J]. The Journal of Practical Medicine, 2026, 42(3): 438-446. |
| [6] | Xuezhen CHEN,Yong LI,Fang ZHANG. Correlation analysis between epicardial fat volume and body composition in children with myodystrophy associated cardiomyopathy [J]. The Journal of Practical Medicine, 2026, 42(11): 1942-1948. |
| [7] | Jie DU,Yanlin GUO,Hanchi YU,Anqi LIU,Linfeng XI,Shuai ZHANG,Wanmu XIE,Yong CHENG,Min LIU. The value of cardiac magnetic resonance imaging-derived perimeter-area ratio in ventricular remodeling of chronic pulmonary thromboembolism [J]. The Journal of Practical Medicine, 2026, 42(10): 1720-1728. |
| [8] | Yehuang WEI,Weiqiang TAN,Xiaoqian GONG,Rongrong WANG,Xudong LIU,Rong LIU. The effect of Qushi Huoxue decoction on the NF-κB/Bcl-2 pathway in metabolic dysfunction-associated steatotic liver disease mice [J]. The Journal of Practical Medicine, 2026, 42(10): 1787-1797. |
| [9] | Yingmei HAN,Yijie LI,Heng ZHANG,Weiqing LI,Ze FENG,Feng WANG. The application value of deep learning in imaging studies for predicting the conversion of Alzheimer′s disease [J]. The Journal of Practical Medicine, 2025, 41(9): 1413-1424. |
| [10] | Li TANG,Yurong GONG,Liye ZENG,Yanfang GAO,Chengzhe. DENG. Application value of 3.0T magnetic resonance imaging T2 mapping sequence combined with serum nesfatin⁃1 level detection in the diagnosis of elderly knee early osteoarthritis [J]. The Journal of Practical Medicine, 2025, 41(8): 1238-1242. |
| [11] | Huiling YE,Zhengchaoyi CHEN,Yihan HUANG,Yingjie ZHANG,Xiangbin ZHANG,Yuehu PU,Renming ZHONG. Radiotherapy treatment comparison of liver SBRT between 4D⁃CT and deep inspiration breath hold troughmagnetic resonance imaging [J]. The Journal of Practical Medicine, 2025, 41(7): 1044-1049. |
| [12] | Na LIU,Tingting LIU,Lihui ZHANG,Liming. WANG. Relationship between fasting blood glucose and non⁃alcoholic fatty liver disease in different genders [J]. The Journal of Practical Medicine, 2025, 41(3): 347-351. |
| [13] | Lili SU,Nuo LI,Wei FANG,Menghua CHEN,Sina QIN,Yegui YANG. Association between residual cholesterol and metabolic associated fatty liver disease risk at different triglyceride levels [J]. The Journal of Practical Medicine, 2025, 41(17): 2676-2682. |
| [14] | Xueying MA,Xiangming MA. Research progress on serum⁃based assessment methods for liver fibrosis in patients with non⁃alcoholic fatty liver disease [J]. The Journal of Practical Medicine, 2025, 41(15): 2290-2303. |
| [15] | Huiliang CAI,Qianying ZHANG,Ying HUANG,Weisheng PENG,Chengli WANG,Cuiting YANG,Na DENG,Sizhu ZHANG,Nina XU,Xiaobing HAN. Assessments of ki⁃67 expression in hepatocellular carcinoma using enhanced MRI intratumoral and peritumoral radiomics and clinical imaging features [J]. The Journal of Practical Medicine, 2025, 41(15): 2311-2319. |
| Viewed | ||||||
|
Full text |
|
|||||
|
Abstract |
|
|||||
