

The Journal of Practical Medicine ›› 2026, Vol. 42 ›› Issue (7): 1243-1249.doi: 10.3969/j.issn.1006-5725.2026.07.017
• Chronic Disease Control • Previous Articles
Luping ZHANG1,Jun LI2,Yanqin FU2( )
)
Received:2025-12-04
Revised:2026-01-04
Accepted:2026-01-05
Online:2026-04-10
Published:2026-04-13
Contact:
Yanqin FU
E-mail:fyqzr668899@163.com
CLC Number:
Luping ZHANG,Jun LI,Yanqin FU. Diagnostic value of UHR, MHR, and 25-hydroxyvitamin D levels in lower extremity artery disease in type 2 diabetes mellitus[J]. The Journal of Practical Medicine, 2026, 42(7): 1243-1249.
Tab.1
Comparison of baseline data and biochemical indicators between the two groups"
| 变量 | T2DM非LEAD组(n = 84) | T2DM合并LEAD组(n = 82) | x2/t/Z值 | P值 |
|---|---|---|---|---|
| 年龄( | 59.99 ± 12.22 | 63.7 ± 10.89 | -2.062 | 0.041 |
| 性别/[例(%)] | 7.664 | 0.006 | ||
| 男 | 44(52.4) | 60(73.2) | ||
| 女 | 40(47.6) | 22(26.8) | ||
| 体质量( | 71.01 ± 14.36 | 71.67 ± 13.18 | -0.310 | 0.757 |
| 身高( | 1.68 ± 0.08 | 1.66 ± 0.09 | -1.630 | 0.105 |
| 吸烟史/[例(%)] | 21(25.0) | 25(30.5) | 0.624 | 0.430 |
| 饮酒史/[例(%)] | 14(16.7) | 20(24.4) | 1.520 | 0.218 |
| 高血压史/[例(%)] | 42(50.0) | 43(52.4) | 0.099 | 0.753 |
| 冠心病史/[例(%)] | 26(31.0) | 23(28.0) | 0.168 | 0.682 |
| 病程/年 | 7(4,15) | 11(5,20) | -2.286 | 0.022 |
| BMI( | 25.59 ± 3.83 | 25.2 ± 3.58 | 0.668 | 0.505 |
| SBP/mmHg | 130(128,135) | 132(128,135) | -0.042 | 0.966 |
| DBP/mmHg | 74(70,80) | 76(70,80) | -0.205 | 0.837 |
| SUA( | 265.02 ± 53.94 | 301.55 ± 79.05 | -3.469 | 0.001 |
| MHR | 0.24(0.19,0.32) | 0.35(0.29,0.47) | -6.088 | < 0.001 |
| UHR( | 202.04 ± 59.55 | 286.53 ± 73.15 | -8.169 | < 0.001 |
| 25(OH)D( | 23.6 ± 5.64 | 17.24 ± 6.27 | 6.879 | < 0.001 |
| HDL-C( | 1.37 ± 0.32 | 1.08 ± 0.22 | 6.948 | < 0.001 |
| LDL-C( | 2.7 ± 1.03 | 2.44 ± 0.92 | 1.727 | 0.086 |
| TC/(mmol/L) | 4.27(3.45,5.32) | 3.99(3.17,4.72) | -1.743 | 0.081 |
| TG/(mmol/L) | 1.48(0.97,2.26) | 1.44(0.97,2.09) | -0.165 | 0.869 |
| non-HDL-C/(mmol/L) | 1.44(0.97,2.09) | 2.71(2.14,3.44) | -1.445 | 0.149 |
| sdLDL-C/(mmol/L) | 0.92(0.60,1.38) | 0.85(0.55,1.17) | -1.149 | 0.251 |
| MONO/(×109/L) | 0.33(0.25,0.42) | 0.40(0.32,0.48) | -3.442 | 0.001 |
| sCr( | 66.94 ± 15.42 | 68.41 ± 13.23 | -0.660 | 0.510 |
| Cys C/(mg/L) | 0.97(0.87,1.14) | 1.00(0.89,1.18) | -0.838 | 0.402 |
| BUN/(mmol/L) | 6.14(5.10,7.40) | 6.31(5.05,7.29) | -0.145 | 0.884 |
| FPG/(mmol/L) | 7.71(6.50,9.90) | 7.52(6.27,9.02) | -0.567 | 0.571 |
| HbA1C/% | 7.89(7.03,8.92) | 7.69(6.59,9.10) | -0.186 | 0.853 |
| C-P/(ng/mL) | 2.73(2.08,3.90) | 3.06(2.27,4.39) | -1.232 | 0.218 |
Tab.2
Pearson correlation analysis of the correlations between UHR, MHR, 25(OH)D and other biochemical indicators"
| 变量 | UHR | MHR | 25(OH)D | |||
|---|---|---|---|---|---|---|
| r值 | P值 | r值 | P值 | r值 | P值 | |
| LDL-C | -0.166 | 0.032 | -0.248 | 0.001 | -0.129 | 0.097 |
| TC | -0.254 | 0.001 | -0.360 | <0.001 | -0.049 | 0.528 |
| Non-HDL-C | -0.138 | 0.099 | -0.321 | <0.001 | -0.065 | 0.436 |
| sCr | 0.207 | 0.007 | 0.140 | 0.072 | 0.008 | 0.920 |
| MONO | 0.242 | 0.002 | - | - | -0.130 | 0.096 |
| 25(OH)D | -0.156 | 0.045 | -0.133 | 0.088 | - | - |
Tab.3
single factor logistic regression analysis of each index and T2DM complicated with LEAD"
| 变量 | P值 | OR | 95%CI |
|---|---|---|---|
| 性别 | 0.006 | 0.403 | 0.211 ~ 0.772 |
| 年龄 | 0.043 | 1.028 | 1.001 ~ 1.056 |
| 病程 | 0.028 | 1.043 | 1.005 ~ 1.082 |
| UHR | < 0.001 | 1.020 | 1.014 ~ 1.027 |
| 25(OH)D | < 0.001 | 0.829 | 0.774 ~ 0.887 |
| Ln_MHR* | < 0.001 | 15.800 | 5.850 ~ 42.673 |
| SUA | 0.001 | 1.009 | 1.003 ~ 1.014 |
| HDL-C | < 0.001 | 0.012 | 0.002 ~ 0.058 |
| Ln_MONO* | 0.001 | 6.216 | 2.154 ~ 17.936 |
Tab.4
Multi-factor Logistic regression analysis of each index and T2DM complicated with LEAD"
| 变量 | P值 | OR | 95%CI |
|---|---|---|---|
| UHR | < 0.001 | 1.020 | 1.011 ~ 1.030 |
| 25(OH)D | < 0.001 | 0.767 | 0.691 ~ 0.852 |
| Ln_MHR* | 0.004 | 7.664 | 1.897 ~ 30.965 |
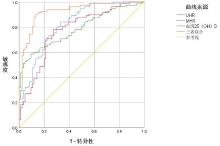
Fig.1
ROC curves of UHR, MHR, and serum 25(OH)D levels for the diagnosis of T2DM complicated with LEAD"
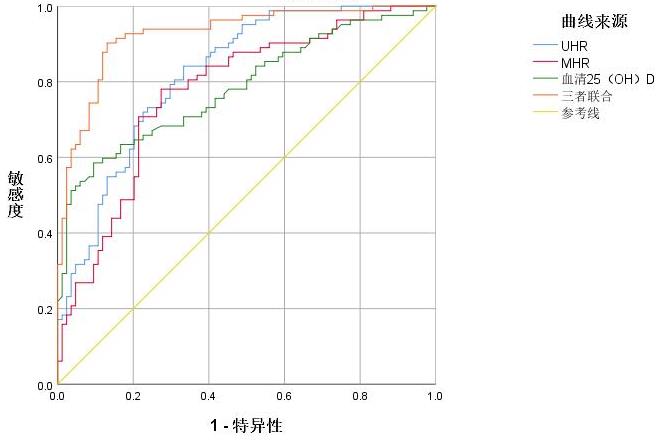
Tab.5
ROC curve analysis of the diagnostic value of UHR, MHR, and serum 25(OH)D for T2DM complicated with LEAD"
| 变量 | AUC(95%CI) | P值 | 敏感度/% | 特异度/% | 约登指数 | cut-off值 |
|---|---|---|---|---|---|---|
| UHR | 0.822(0.760 ~ 0.885) | < 0.001 | 84.1 | 66.7 | 0.508 | 215.32 |
| 25(OH)D | 0.784(0.715 ~ 0.854) | < 0.001 | 58.5 | 90.5 | 0.490 | 17.74 ng/mL |
| MHR | 0.774(0.702 ~ 0.845) | < 0.001 | 78.0 | 72.6 | 0.506 | 0.29 |
| 三者联合 | 0.927(0.887 ~ 0.966) | < 0.001 | 90.2 | 86.9 | 0.771 | - |
| [1] |
ZHANG X, RAN X, XU Z, et al.China DIA-LEAD Study Investigators. Epidemiological characteristics of lower extremity arterial disease in Chinese diabetes patients at high risk: A prospective, multicenter, cross-sectional study[J]. J Diabetes Complications, 2018, 32(2):150-156. doi: 10.1016/j.jdiacomp.2017.10.003 .
doi: 10.1016/j.jdiacomp.2017.10.003 |
| [2] |
AGNELLI G, BELCH J, BAUMGARTNER I, et al. Morbidity and mortality associated with atherosclerotic peripheral artery disease: A systematic review[J]. Atherosclerosis, 2020, 293:94-100. doi: 10.1016/j.atherosclerosis.2019.09.012 .
doi: 10.1016/j.atherosclerosis.2019.09.012 |
| [3] |
GOLLEDGE J. Update on the pathophysiology and medical treatment of peripheral artery disease[J]. Nat Rev Cardiol, 2022, 19(7):456-474. doi: 10.1038/s41569-021-00663-9 .
doi: 10.1038/s41569-021-00663-9 |
| [4] |
中华医学会糖尿病学分会. 中国糖尿病防治指南(2024 版)[J]. 中华糖尿病杂志, 2025, 17(1): 20-65. doi: 10.3760/cma.j.cn115791-20241203-00705 .
doi: 10.3760/cma.j.cn115791-20241203-00705 |
| [5] |
KOLAHI A R, MANSOORI A, SAHANAVARD T, et al. Serum uric acid to high-density lipoprotein ratio as a novel indicator of inflammation is correlated with the presence and severity of metabolic syndrome: A large-scale study[J]. Endocrinol Diabetes Metab, 2023, 6(6):e446. doi: 10.1002/edm2.446 .
doi: 10.1002/edm2.446 |
| [6] |
HUANG C, LUO Y, HUANG J, et al. A Cross-Sectional Study of the Association Between Uric Acid-to-High-Density Lipoprotein Cholesterol Ratio and Carotid Atherosclerosis in Patients with Type 2 Diabetes Mellitus[J]. Diabetes Metab Syndr Obes, 2025, 18:2873-2883. doi: 10.2147/DMSO.S527130 .
doi: 10.2147/DMSO.S527130 |
| [7] |
CHEN X, ZHANG J, LU F, et al. Association between uric acid to high-density lipoprotein cholesterol ratio and chronic kidney disease in Chinese patients with type 2 diabetes mellitus: A cross-sectional study[J]. Front Nutr, 2025, 12:1582495. doi: 10.3389/fnut.2025.1582495 .
doi: 10.3389/fnut.2025.1582495 |
| [8] |
WANG L, LIU L, LUO H, et al. Correlation Between the Ratio of Uric Acid to High-Density Lipoprotein Cholesterol (UHR) and Diabetic Retinopathy in Patients with Type 2 Diabetes Mellitus:A Cross-Sectional Study[J]. Diabetes Metab Syndr Obes, 2025, 18:173-183. doi: 10.2147/DMSO.S504308 .
doi: 10.2147/DMSO.S504308 |
| [9] |
YILMAZ M, KAYANCIÇEK H.A New Inflammatory Marker: Elevated Monocyte to HDL Cholesterol Ratio Associated with Smoking[J]. J Clin Med, 2018, 7(4):76. doi: 10.3390/jcm7040076 .
doi: 10.3390/jcm7040076 |
| [10] |
IANNUZZO G, FORTE F, LUPOLI R, et al. Association of Vitamin D deficiency with peripheral arterial disease: A meta-analysis of literature studies[J]. J Clin Endocrinol Metab, 2018.103(6):2107-2115. doi: 10.1210/jc.2018-00136 .
doi: 10.1210/jc.2018-00136 |
| [11] |
XU X Y, WU H Y, WEI Q. Obesity-related indices as predictors of lower extremity arterial disease in type 2 diabetes mellitus[J]. Endocrine, 2025, 87(2):554-561. doi: 10.1007/s12020-024-04039-0 .
doi: 10.1007/s12020-024-04039-0 |
| [12] |
JIANG T, XIE D, WU J, et al.Association between serum copper levels and prevalence of hyperuricemia: A cross-sectional study[J]. Sci Rep, 2020, 10(1):8687. doi: 10.1038/s41598-020-65639-0 .
doi: 10.1038/s41598-020-65639-0 |
| [13] |
KHOSLA U M. Hyperuricemia induces endothelial dysfunction[J]. Kidney Int, 2005, 67(5):1739-1742. doi: 10.1111/j.1523-1755.2005.00273.x .
doi: 10.1111/j.1523-1755.2005.00273.x |
| [14] |
CATHCART M K. Regulation of superoxide anion production by NADPH oxidase in monocytes/macrophages: Contributions to atherosclerosis[J]. Arterioscler Thromb Vasc Biol, 2004, 24(1):23-28. doi: 10.1161/01.ATV.0000097769.47306.12 .
doi: 10.1161/01.ATV.0000097769.47306.12 |
| [15] |
WADHAM C, ALBANESE N, ROBERTS J, et al. High-density lipoproteins neutralize C-reactive protein proinflammatory activity[J]. Circulation, 2004, 109(17):2116-2122. doi: 10.1161/01.CIR.0000127419.45975.26 .
doi: 10.1161/01.CIR.0000127419.45975.26 |
| [16] |
王凯阳,永佳蕙,陶静,等.血浆致动脉粥样硬化指数对急性心肌梗死患者长期预后的影响[J].实用医学杂志,2025,41(23):3697-3703.doi:10.3969/j.issn.1006-5725.2025.23.010 .
doi: 10.3969/j.issn.1006-5725.2025.23.010 |
| [17] |
林立龙,马煜盛,林子祥,等.高密度脂蛋白颗粒、C反应蛋白在冠心病合并2型糖尿病人群中的临床意义[J].实用医学杂志,2019,35(12):1920-1925.doi:10.3969/j.issn.1006-5725.2019.12.013 .
doi: 10.3969/j.issn.1006-5725.2019.12.013 |
| [18] |
AKTAS G, KOCAK M Z, BILGIN S, et al. Uric acid to HDL cholesterol ratio is a strong predictor of diabetic control in men with type 2 diabetes mellitus[J]. Aging Male, 2020, 23(5):1098-1102. doi: 10.1080/13685538.2019.1678126 .
doi: 10.1080/13685538.2019.1678126 |
| [19] |
SHAO C, FEI C, GU M, et al.Comparative Predictive Value of the TyG Index and UHR for Lower Extremity Artery Disease in Type 2 Diabetes: A Retrospective Analysis[J]. Diabetes Metab Syndr Obes, 2025, 18:1341-1351. doi: 10.2147/DMSO.S496727 .
doi: 10.2147/DMSO.S496727 |
| [20] |
CHEN J W, LI C, LIU Z H, et al. The Role of Monocyte to High-Density Lipoprotein Cholesterol Ratio in Prediction of Carotid Intima-Media Thickness in Patients With Type 2 Diabetes[J]. Front Endocrinol (Lausanne), 2019, 10:191. doi: 10.3389/fendo.2019.00191 .
doi: 10.3389/fendo.2019.00191 |
| [21] |
WANG Y, JIANG Q, LI X, et al. Lipid metabolism-related inflammatory indices (LMIIs) and incident peripheral artery diseases (PAD) in patients with type 2 diabetes mellitus (T2DM): A multicohort study from China and the UK biobank[J]. Cardiovasc Diabetol, 2025, 24(1):346. doi: 10.1186/s12933-025-02887-2 .
doi: 10.1186/s12933-025-02887-2 |
| [22] |
ZHANG H, LU J, GAO J, et al. Association of Monocyte-to-HDL Cholesterol Ratio with Endothelial Dysfunction in Patients with Type 2 Diabetes[J]. J Diabetes Res, 2024, 2024(1):5287580. doi: 10.1155/2024/5287580 .
doi: 10.1155/2024/5287580 |
| [23] |
MELAMED M L, MUNTNER P, MICHOS E D, et al. Serum 25-hydroxyvitamin D levels and the prevalence of peripheral arterial disease: Results from NHANES 2001 to 2004[J]. Arterioscler Thromb Vasc Biol, 2008, 28(6):1179-1185. doi: 10.1161/ATVBAHA.108.165886 .
doi: 10.1161/ATVBAHA.108.165886 |
| [24] |
PARK S, KIM D S, KANG S. Vitamin D deficiency impairs glucose-stimulated insulin secretion and increases insulin resistance by reducing PPAR-γ expression in nonobese Type 2 diabetic rats[J]. J Nutr Biochem, 2016, 27:257-265. doi: 10.1016/j.jnutbio.2015.09.013 .
doi: 10.1016/j.jnutbio.2015.09.013 |
| [25] |
SCHLEITHOFF S S, ZITTERMANN A, TENDERICH G, et al. Vitamin D supplementation improves cytokine profiles in patients with congestive heart failure: A double-blind, randomized, placebo-controlled trial[J]. Am J Clin Nutr, 2006, 83(4):754-759. doi: 10.1093/ajcn/83.4.754 .
doi: 10.1093/ajcn/83.4.754 |
| [26] |
YINK K, YOU Y, SWIER V, et al. Vitamin D Protects Against Atherosclerosis via Regulation of Cholesterol Efflux and Macrophage Polarization in Hypercholesterolemic Swine[J]. Arterioscler Thromb Vasc Biol, 2015, 35(11):2432-2442. doi: 10.1161/ATVBAHA.115.306132 .
doi: 10.1161/ATVBAHA.115.306132 |
| [27] |
BABAEI M R, MALEK M, ROSTAMI F T, et al. Non-invasive vascular assessment in people with type 2 diabetes: Diagnostic performance of Plethysmographic-and-Doppler derived ankle brachial index, toe brachial index, and pulse volume wave analysis for detection of peripheral arterial disease[J]. Prim Care Diabetes, 2020, 14(3):282-289. doi: 10.1016/j.pcd.2019.09.005 .
doi: 10.1016/j.pcd.2019.09.005 |
| [28] |
ALAGHA M, AHERNE T M, HASSANIN A, et al. Diagnostic Performance of Ankle-Brachial Pressure Index in Lower Extremity Arterial Disease[J]. Surg J (N Y), 2021, 7(3):e132-e137. doi: 10.1055/s-0041-1731444 .
doi: 10.1055/s-0041-1731444 |
| Viewed | ||||||
|
Full text |
|
|||||
|
Abstract |
|
|||||