

The Journal of Practical Medicine ›› 2025, Vol. 41 ›› Issue (4): 569-574.doi: 10.3969/j.issn.1006-5725.2025.04.016
• Clinical Research • Previous Articles
Xiuli FENG1,Zhichen ZHENG2,Tongyu ZHANG2,Li ZHOU2,Ning XU2,Renhao ZHAO3,Teng YANG4,Na WANG1,Guofeng. WANG1( )
)
Received:2024-11-05
Online:2025-02-25
Published:2025-02-28
Contact:
Guofeng. WANG
E-mail:nfmwangguofeng@126.com
CLC Number:
Xiuli FENG,Zhichen ZHENG,Tongyu ZHANG,Li ZHOU,Ning XU,Renhao ZHAO,Teng YANG,Na WANG,Guofeng. WANG. Study on the correlation between blood glucose fluctuations and type 2 diabetic foot based on flash glucose monitoring technology[J]. The Journal of Practical Medicine, 2025, 41(4): 569-574.
Tab.1
Baseline characteristics of two groups"
| 临床资料 | 非糖尿病足组(n = 147) | 糖尿病足组(n = 86) | Z/χ2值 | P值 |
|---|---|---|---|---|
| 年龄/岁 | 60(50,75) | 61.5(49,79) | -0.606 | 0.545 |
| 男性/[例(%)] | 72(48.98) | 42(48.84) | 0.000 | 0.983 |
| 病程/年 | 9(9,10) | 14(13,15.25) | -12.686 | < 0.001 |
| BMI/(kg/m2) | 22.4(21.4,23.6) | 22.8(21.8,24.2) | -1.983 | 0.047 |
| 收缩压/mmHg | 145(138,154) | 147(138,158) | -0.864 | 0.388 |
| 舒张压/mmHg | 94(89,102) | 96(91,103) | -1.602 | 0.109 |
| FPG/(mmol/L) | 9.29(8.36,11.25) | 9.585(8.837 5,10.47) | -1.139 | 0.255 |
| HbA1c/% | 8.4(7.1,10.4) | 9.7(8.175,11.325) | -3.719 | < 0.001 |
| FCP/(pmol/L) | 583.42(538.46,621.61) | 546.91(501.99,601.425) | -3.929 | < 0.001 |
| FINS/(μIU/mL) | 7.08(5.87,9.41) | 6.04(5.212 5,6.89) | -5.786 | < 0.001 |
| BUN/(mmol/L) | 5.42(4.68,6.41) | 5.695(4.962 5,6.927 5) | -1.958 | 0.050 |
| Scr/(μmol/L) | 57(49,70) | 62.5(50,78) | -1.880 | 0.060 |
| UACR/(mg/g) | 41.87(34,51.85) | 206.3(154.64,267.247 5) | -12.731 | < 0.001 |
| AST/(U/L) | 18(12,29) | 18(12,28.25) | -0.262 | 0.793 |
| ALT/(U/L) | 21(17,25) | 22(19,27) | -2.622 | 0.009 |
| SUA/(mmol/L) | 245(238,256) | 296(286,310.25) | -12.499 | < 0.001 |
| TC/(mmol/L) | 4.24(3.58,5.15) | 3.955(3.202 5,5.432 5) | -1.549 | 0.121 |
| TG/(mmol/L) | 1.43(1.06,1.98) | 1.325(0.402 5,2.735) | -0.737 | 0.461 |
| HDL-C/(mmol/L) | 1.26(1.13,1.45) | 1.14(1.037 5,1.38) | -3.378 | < 0.001 |
| LDL-C/(mmol/L) | 2.64(2.10,3.26) | 2.74(2.307 5,3.502 5) | -1.574 | 0.115 |
| DPN/[例(%)] | 9(6.12) | 29(33.72) | 30.278 | < 0.001 |
| DR/[例(%)] | 5(3.40) | 26(30.23) | 33.864 | < 0.001 |
| DN/[例(%)] | 12(8.16) | 16(18.60) | 5.595 | 0.018 |
| 高血压/[例(%)] | 24(16.33) | 30(34.88) | 10.494 | 0.001 |
| 冠心病/[例(%)] | 11(7.48) | 12(13.95) | 2.553 | 0.110 |
Tab.2
Blood glucose fluctuation indicators of two groups"
| 血糖波动指标 | 非糖尿病足组(n = 147) | 糖尿病足组(n = 86) | Z值 | P值 |
|---|---|---|---|---|
| TIR/% | 53.55(34.94,84.76) | 27.465(14.855,33.86) | -8.911 | < 0.001 |
| SDBG/(mmol/L) | 2.5(1.8,3.2) | 2.8(1.075,4.6) | -0.328 | 0.743 |
| MAGE/(mmol/L) | 5.5(4.6,6.6) | 7.9(6.8,9.925) | -9.366 | < 0.001 |
| CV/% | 27.9(21.7,35) | 32.05(25.7,39.275) | -2.950 | 0.003 |
| MODD/(mmol/L) | 1.8(1.7,1.9) | 2.3(1.875,2.9) | -6.823 | < 0.001 |
| MBG/(mmol/L) | 8.8(6.5,11.6) | 10.75(7.175,15.75) | -3.029 | 0.002 |
Tab.3
Subgroup analysis of TIR and the risk of chronic complication of diabetes"
| 组别 | DPN | DR | DN | 高血压 | 冠心病 | 糖尿病足 |
|---|---|---|---|---|---|---|
| > 85%(n = 36) | 5(13.9) | 0(0)? | 1(2.8) | 7(19.4) | 3(8.3) | 1(2.8%)?# |
| 71%~85%(n = 25) | 1(4.0) | 0(0) | 5(20) | 3(12.0) | 1(4.0) | 2(8.0%)? |
| 51%~70%(n = 29) | 5(17.2) | 2(6.9) | 2(6.9) | 6(20.7) | 3(10.3) | 8(27.6) |
| ≤ 50%(n = 143) | 27(18.9) | 29(20.3) | 20(14.0) | 38(26.6) | 16(11.2) | 75(52.4) |
| χ2值 | 3.613 | 17.641 | 5.648 | 3.063 | 1.036 | 42.891 |
| P值 | 0.304 | < 0.001 | 0.119 | 0.382 | 0.809 | < 0.001 |
Tab.4
Binary logistic regression analysis of risk factors for the occurrence of DF"
| 项目 | B值 | SE值 | Waldχ2值 | P值 | OR值 | 95%CI |
|---|---|---|---|---|---|---|
| HbA1c | 0.314 | 0.129 | 5.951 | 0.015 | 1.369 | 1.064~1.762 |
| TIR | -0.075 | 0.019 | 15.999 | < 0.001 | 0.928 | 0.895~0.963 |
| MAGE | 0.795 | 0.156 | 25.924 | < 0.001 | 2.215 | 1.631~3.009 |
| CV | 0.035 | 0.027 | 1.759 | 0.185 | 1.036 | 0.983~1.092 |
| MODD | 4.342 | 0.998 | 18.926 | < 0.001 | 76.856 | 10.867~543.544 |
| MBG | 0.149 | 0.058 | 6.551 | 0.010 | 1.161 | 1.036~1.302 |
| 常量 | -17.297 | 3.289 | 27.650 | < 0.001 | < 0.001 | - |
Tab.5
Analysis of the predictive value of HbA1c, TIR, MAGE, MODD, MBG, and their combination for the occurrence of DF in T2DM patients"
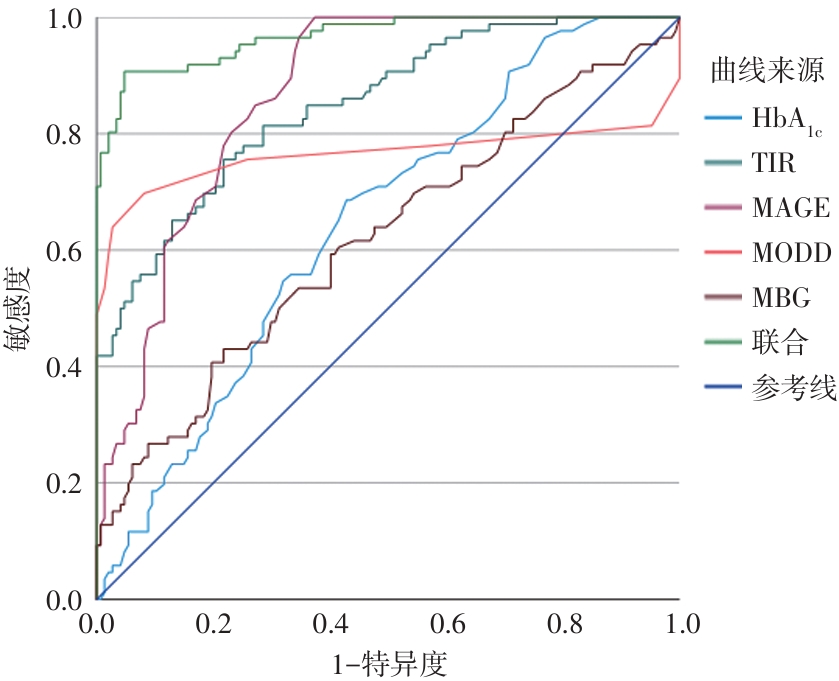
| 指标 | AUC | 95%CI | P值 | 截断值 | 约登指数 | 敏感度/% | 特异度/% |
|---|---|---|---|---|---|---|---|
| HbA1c | 0.646 | 0.575~0.717 | < 0.001 | 8.85% | 0.257 | 68.60 | 57.10 |
| TIR | 0.850 | 0.800~0.900 | < 0.001 | 33.86% | 0.538 | 78.20 | 75.60 |
| MAGE | 0.868 | 0.824~0.912 | < 0.001 | 5.95 mmol/L | 0.626 | 100.00 | 62.60 |
| MODD | 0.764 | 0.681~0.848 | < 0.001 | 1.95 mmol/L | 0.616 | 69.80 | 91.80 |
| MBG | 0.619 | 0.543~0.695 | 0.002 | 11.95 mmol/L | 0.212 | 43.00 | 78.20 |
| 联合 | 0.967 | 0.945~0.988 | < 0.001 | - | 0.859 | 90.70 | 95.20 |
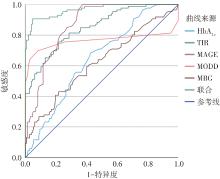
Fig.1
ROC curves of HbA1c, TIR, MAGE, MODD, MBG, and their combination for predicting DF in T2DM patients"
| 1 |
ANONYMOUS. Summary of revisions: Standards of medical care in diabetes-2020 [J]. Diabetes Care, 2020, 43(): S4-S6. doi:10.2337/dc20-srev
doi: 10.2337/dc20-srev |
| 2 | 申晶,窦京涛. 糖尿病大血管并发症管理的思考: 历史与未来 [J]. 中华糖尿病杂志,2020,12(11): 857-860. |
| 3 |
李婉媚,杨旭斌,黄懿文,等. 血糖波动对糖尿病大鼠心脏自主神经功能的影响及其机制 [J]. 实用医学杂志,2021,37(16): 2065-2068+2074. doi:10.3969/j.issn.1006-5725.2021.16.006
doi: 10.3969/j.issn.1006-5725.2021.16.006 |
| 4 |
GUO Q, ZANG P, XU S, et al. Time in range, as a novel metric of glycemic control, is reversely associated with presence of diabetic cardiovascular autonomic neuropathy independent of HbA1c in Chinese type 2 diabetes [J]. J Diabetes Res, 2020, 2020(1): 5817074. doi:10.1155/2020/5817074
doi: 10.1155/2020/5817074 |
| 5 |
KIM M Y, KIM G, PARK J Y, et al. The association between continuous glucose monitoring-derived metrics and cardiovascular autonomic neuropathy in outpatients with type 2 diabetes [J]. Diabetes Technol Ther, 2021, 23(6): 434-442. doi:10.1089/dia.2020.0599
doi: 10.1089/dia.2020.0599 |
| 6 |
LU J, MA X, SHEN Y, et al. Time in range is associated with carotid intima-media thickness in type 2 diabetes [J]. Diabetes Technol Ther, 2020, 22(2): 72-78. doi:10.1089/dia.2019.0251
doi: 10.1089/dia.2019.0251 |
| 7 |
COSTANTINO S, PANENI F, BATTISTA R, et al. Impact of glycemic variability on chromatin remodeling, oxidative stress, and endothelial dysfunction in patients with type 2 diabetes and with target HbA1c levels [J]. Diabetes, 2017, 66(9): 2472-2482. doi:10.2337/db17-0294
doi: 10.2337/db17-0294 |
| 8 |
TAYA N, KATAKAMI N, MITA T, et al. Associations of continuous glucose monitoring-assessed glucose variability with intima-media thickness and ultrasonic tissue characteristics of the carotid arteries: A cross-sectional analysis in patients with type 2 diabetes [J]. Cardiovasc Diabetol, 2021, 20(1): 95. doi:10.1186/s12933-021-01288-5
doi: 10.1186/s12933-021-01288-5 |
| 9 | 中华医学会糖尿病学分会. 中国2型糖尿病防治指南(2017年版) [J]. 中华糖尿病杂志,2018,10(1): 4-67. |
| 10 | 中华医学会糖尿病学分会,中华医学会感染病学分会,中华医学会组织修复与再生分会,等. 中国糖尿病足防治指南(2019版)(Ⅰ) [J]. 中华糖尿病杂志,2019,11(2): 92-108. |
| 11 |
CHATZIRALLI I P. The role of glycemic control and variability in diabetic retinopathy [J]. Diabetes Ther, 2018, 9(1): 431-434. doi:10.1007/s13300-017-0345-5
doi: 10.1007/s13300-017-0345-5 |
| 12 | 张艳,余维巍,姚济华,等. 老年2型糖尿病患者血糖变异性与糖尿病肾病的关系 [J]. 实用医学杂志,2013,29(2): 202-204. |
| 13 |
TORIMOTO K, OKADA Y, MORI H, et al. Relationship between fluctuations in glucose levels measured by continuous glucose monitoring and vascular endothelial dysfunction in type 2 diabetes mellitus [J]. Cardiovasc Diabetol, 2013, 12(1):1. doi:10.1186/1475-2840-12-1
doi: 10.1186/1475-2840-12-1 |
| 14 |
TANG X, LI S, WANG Y, et al. Glycemic variability evaluated by continuous glucose monitoring system is associated with the 10-y cardiovascular risk of diabetic patients with well-controlled HbA1c [J]. Clin Chim Acta, 2016, 461: 146-150. doi:10.1016/j.cca.2016.08.004
doi: 10.1016/j.cca.2016.08.004 |
| 15 |
KLIMONTOV V V, SAIK O V, KORBUT A I. Glucose variability: How does it work? [J]. Int J Mol Sci, 2021, 22(15): 7783. doi:10.3390/ijms22157783
doi: 10.3390/ijms22157783 |
| 16 |
AKAZA M, AKAZA I, KANOUCHI T, et al. Nerve conduction study of the association between glycemic variability and diabetes neuropathy [J]. Diabetol Metab Syndr, 2018, 10(1):69. doi:10.1186/s13098-018-0371-0
doi: 10.1186/s13098-018-0371-0 |
| 17 |
DHATARIYA K K, SIN E L P W P, CHENG J O S, et al. The impact of glycaemic variability on wound healing in the diabetic foot⁃A retrospective study of new ulcers presenting to a specialist multidisciplinary foot clinic [J]. Diabetes Res Clin Pract, 2018, 135: 23-29. doi:10.1016/j.diabres.2017.10.022
doi: 10.1016/j.diabres.2017.10.022 |
| 18 |
PELED S, POLLACK R, ELISHOOV O, et al. Association of inpatient glucose measurements with amputations in patients hospitalized with acute diabetic foot [J]. J Clin Endocrinol Metab, 2019, 104(11): 5445-5452. doi:10.1210/jc.2019-00774
doi: 10.1210/jc.2019-00774 |
| 19 |
LU J, MA X, ZHANG L, et al. Glycemic variability modifies the relationship between time in range and hemoglobin A1c estimated from continuous glucose monitoring: A preliminary study [J]. Diabetes Res Clin Pract, 2020, 161: 108032. doi:10.1016/j.diabres.2020.108032
doi: 10.1016/j.diabres.2020.108032 |
| 20 |
VIGERSKY R A, MCMAHON C. The relationship of hemoglobin A1C to time-in-range in patients with diabetes [J]. Diabetes Technol Ther, 2019, 21(2): 81-85. doi:10.1089/dia.2018.0310
doi: 10.1089/dia.2018.0310 |
| 21 |
BELLIDO V, PINÉS-CORRALES P J, VILLAR-TAIBO R, et al. Time-in-range for monitoring glucose control: Is it time for a change? [J]. Diabetes Res Clin Pract, 2021, 177: 108917. doi:10.1016/j.diabres.2021.108917
doi: 10.1016/j.diabres.2021.108917 |
| 22 |
YANG J, YANG X, ZHAO D, et al. Association of time in range, as assessed by continuous glucose monitoring, with painful diabetic polyneuropathy [J]. J Diabetes Investig, 2021, 12(5): 828-836. doi:10.1111/jdi.13394
doi: 10.1111/jdi.13394 |
| 23 |
YAPANIS M, JAMES S, CRAIG M E, et al. Complications of diabetes and metrics of glycemic management derived from continuous glucose monitoring [J]. J Clin Endocrinol Metab, 2022, 107(6): e2221-e2236. doi:10.1210/clinem/dgac034
doi: 10.1210/clinem/dgac034 |
| 24 |
HUANG Z X, ZHANG H H, HUANG Y, et al. Association of time in range with postoperative wound healing in patients with diabetic foot ulcers [J]. Int Wound J, 2022, 19(6): 1309-1318. doi:10.1111/iwj.13725
doi: 10.1111/iwj.13725 |
| 25 |
BECK R W, BERGENSTAL R M, RIDDLESWORTH T D, et al. Validation of time in range as an outcome measure for diabetes clinical trials [J]. Diabetes Care, 2019, 42(3): 400-405. doi:10.2337/dc18-1444
doi: 10.2337/dc18-1444 |
| 26 |
MAYEDA L, KATZ R, AHMAD I, et al. Glucose time in range and peripheral neuropathy in type 2 diabetes mellitus and chronic kidney disease [J]. BMJ Open Diabetes Res Care, 2020, 8(1): e000991. doi:10.1136/bmjdrc-2019-000991
doi: 10.1136/bmjdrc-2019-000991 |
| 27 |
LU J, WANG C, SHEN Y, et al. Time in range in relation to all-cause and cardiovascular mortality in patients with type 2 diabetes: A prospective cohort study [J]. Diabetes Care, 2021, 44(2): 549-555. doi:10.2337/dc20-1862
doi: 10.2337/dc20-1862 |
| Viewed | ||||||
|
Full text |
|
|||||
|
Abstract |
|
|||||