

The Journal of Practical Medicine ›› 2025, Vol. 41 ›› Issue (12): 1899-1906.doi: 10.3969/j.issn.1006-5725.2025.12.019
• Medical Examination and Clinical Diagnosis • Previous Articles
Yuexian LYU1,Xiu BI2,Ying LIU1,Shujing CUI1,Lixin ZHAO3,Ge GAO1,Jianxia WANG4,Juan LI5,Jun LI1( )
)
Received:2025-03-24
Online:2025-06-25
Published:2025-07-02
Contact:
Jun LI
E-mail:yshl19870601@126.com
CLC Number:
Yuexian LYU,Xiu BI,Ying LIU,Shujing CUI,Lixin ZHAO,Ge GAO,Jianxia WANG,Juan LI,Jun LI. The efficacy of plasma gasdermin D C⁃terminal fragment in the early diagnosis of sepsis[J]. The Journal of Practical Medicine, 2025, 41(12): 1899-1906.
Tab.1
Comparison of baseline data among different groups of research subjects"
| 组别 | 样本量 | 年龄/岁 | 男性/[例(%)] | 糖尿病 /[例(%)] | 呼吸系统疾病 /[例(%)] | 消化系统疾病 /[例(%)] | 神经系统 /[例(%)] |
|---|---|---|---|---|---|---|---|
| HC组 | 200 | 65.0(55.0,72.0) | 133(66.50) | ||||
| SIRS组 | 145 | 66.5(56.0,75.0) | 94(64.80) | 4(2.80) | 52(35.90) | 18(12.40) | 32(22.10) |
| Sepsis组 | 100 | 69.0(59.5,74.5) | 70(70.00) | 7(7.00) | 25(25.00) | 16(16.00) | 31(31.00) |
| H/χ2值 | 4.768 | 0.723 | 1.592 | 3.240 | 0.637 | 2.471 | |
| P值 | 0.092 | 0.697 | 0.207 | 0.072 | 0.425 | 0.116 |
Tab.2
Comparison of etiological characteristics in patients with sepsis"
| 组别 | 样本量 | 年龄/岁 | 男性 /[例(%)] | 糖尿病 /[例(%)] | 呼吸系统疾病 /[例(%)] | 消化系统疾病 /[例(%)] | 神经系统疾病/[例(%)] |
|---|---|---|---|---|---|---|---|
| Gram-positive组 | 17 | 75.0(67.0,78.5) | 12(70.60) | 1(5.90) | 6(35.30) | 2(11.80) | 6(35.30) |
| Gram-negative组 | 77 | 69.0(58.5,75.5) | 53(68.80) | 5(6.50) | 18(23.40) | 12(15.60) | 24(31.20) |
| Fungal组 | 6 | 73.5(67.5,78.0) | 5(83.30) | 1(16.70) | 1(16.70) | 2(33.30) | 1(16.70) |
| H/χ2值 | 4.000 | - | - | - | - | - | |
| P值 | 0.135 | 0.923 | 0.430 | 0.569 | 0.400 | 0.728 |
Tab.3
Performance parameters of GSDMD-CT chemiluminescence detection kit"
| 性能指标 | 结果 |
|---|---|
| 线性范围/(pg/mL) | 1 ~ 3 000 |
| 检出限/(pg/mL) | ≤ 1 |
| 准确度/% | 85% ~ 115% |
| 批内变异系数/% | < 8% |
| 批间变异系数/% | < 15% |
| 各组分热稳定性/% | < 10% |
| 校准品各点热稳定性/% | < 10% |
| 质控品各点热稳定性/% | < 10% |
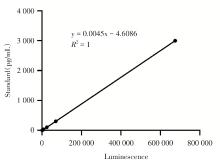
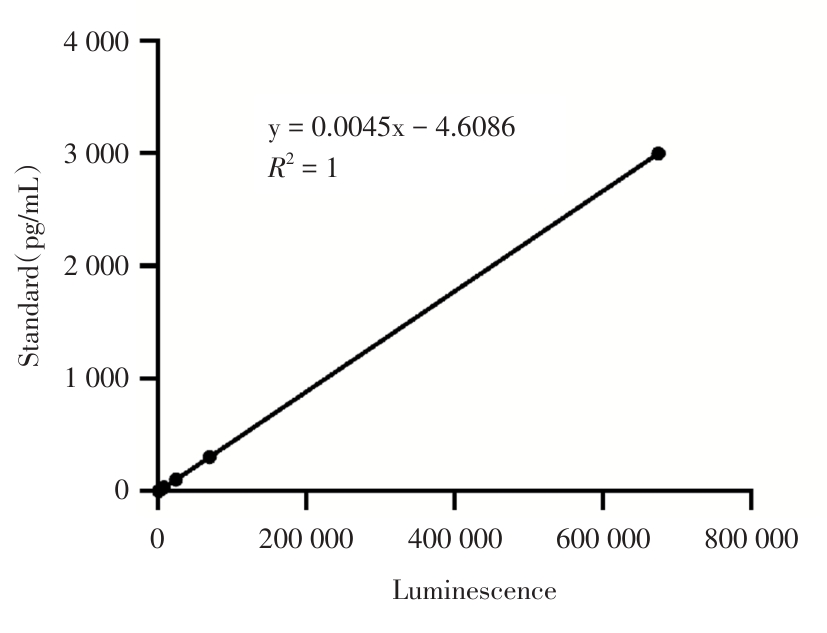
Fig.1
GSDMD-CT chemiluminescence detection system standard curve"
Tab.4
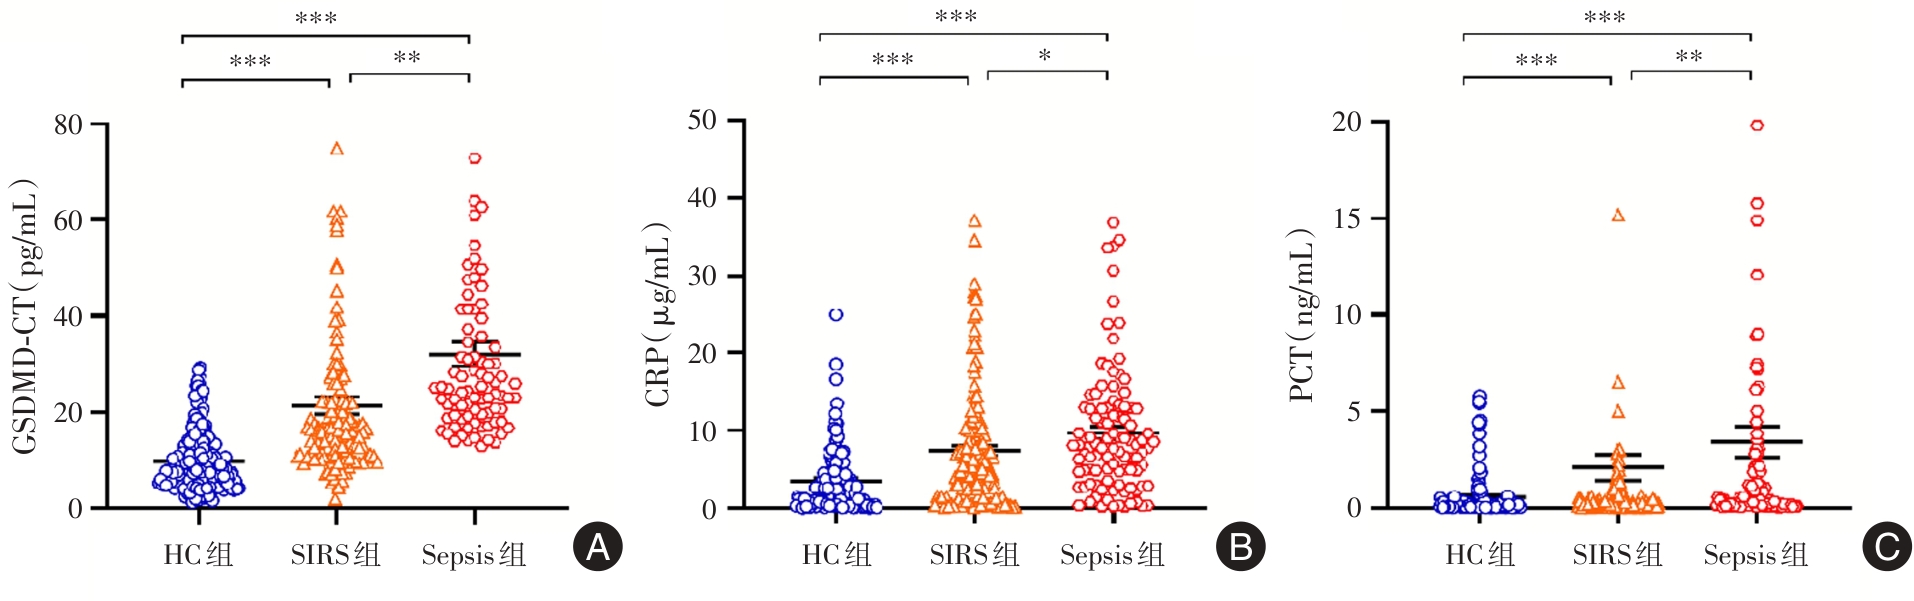
Comparison of biomarkers in the sepsis group, SIRS group, and the healthy control group"
| 组别 | 样本量 | GSDMD-CT/(pg/mL) | CRP/(μg/mL) | PCT/(ng/mL) |
|---|---|---|---|---|
| HC 组 | 200 | 7.02(4.42,11.43) | 2.56(0.88,4.60) | 0.08(0.04,0.27) |
| SIRS组 | 145 | 16.52(11.26,22.22) | 5.01(2.02,10.11) | 0.19(0.08,0.75) |
| Sepsis组 | 100 | 23.02(16.71,33.01) | 8.10(3.76,12.92) | 0.43(0.12,2.67) |
| H值 | 125.37 | 54.92 | 41.15 | |
| P值 | < 0.001 | < 0.001 | < 0.001 |
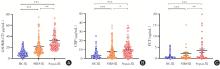
Fig.2
The expression levels of GSDMD-CT, CRP, PCT in the HC, SIRS, and Sepsis group"
Tab.5
Comparison of GSDMD-CT expression levels in patients with sepsis infected with different pathogens M(P25,P75)/(pg/mL)"
| 组别 | 样本量 | GSDMD-CT |
|---|---|---|
| Gram-positive组 | 17 | 23.01(17.16,27.51) |
| Gram-negative组 | 77 | 23.41(16.78,35.50) |
| Fungal组 | 6 | 16.29(14.53,56.27) |
| H值 | 0.526 | |
| P值 | 0.769 |
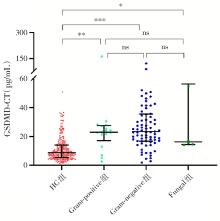
Fig.3
Comparison of GSDMD-CT expression levels in healthy control group and patients with sepsis infected with different pathogens"

Tab.6
Logistic regression analysis of independent risk factors for sepsis"
| 影响因素 | β | SE | Wald χ2 | P值 | OR(95%CI) |
|---|---|---|---|---|---|
| GSDMD-CT | 0.192 | 0.033 | 33.906 | < 0.001 | 1.212(1.136 ~ 1.293) |
| CRP | 0.178 | 0.049 | 13.214 | < 0.001 | 1.195(1.085 ~ 1.315) |
| PCT | 0.828 | 0.397 | 4.349 | 0.037 | 2.289(1.051 ~ 4.986) |
Tab.7
The efficacy analysis results of GSDMD-CT,CRP,PCT and combined diagnosis for the sepsis"
| 指标 | AUC | 95%CI | 敏感度/% | 特异度/% | 约登指数 | P值 |
|---|---|---|---|---|---|---|
| GSDMD-CT | 0.881 | 0.833 ~ 0.929 | 85.0 | 84.5 | 0.695 | < 0.001 |
| CRP | 0.782 | 0.719 ~ 0.844 | 75.0 | 76.7 | 0.517 | < 0.001 |
| PCT | 0.733 | 0.666 ~ 0.799 | 69.0 | 70.7 | 0.397 | < 0.001 |
| GSDMD-CT+PCT+CRP | 0.921 | 0.884 ~ 0.958 | 80.0 | 91.4 | 0.714 | < 0.001 |
| GSDMD-CT+CRP | 0.920 | 0.882 ~ 0.957 | 87.0 | 83.6 | 0.706 | < 0.001 |
| GSDMD-CT+PCT | 0.882 | 0.834 ~ 0.929 | 85.0 | 83.6 | 0.686 | < 0.001 |
| PCT+CRP | 0.797 | 0.737 ~ 0.856 | 77.0 | 74.1 | 0.511 | < 0.001 |
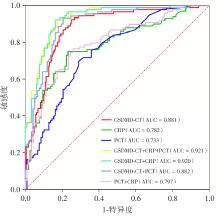
Fig. 4
Receiver operating characteristic curves of GSDMD-CT, CRP, PCT and combined diagnosis for the sepsis"
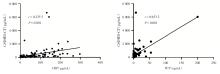
Fig. 5
Correlation analysis for the expression Of GSDMD-CT with CRP and PCT"
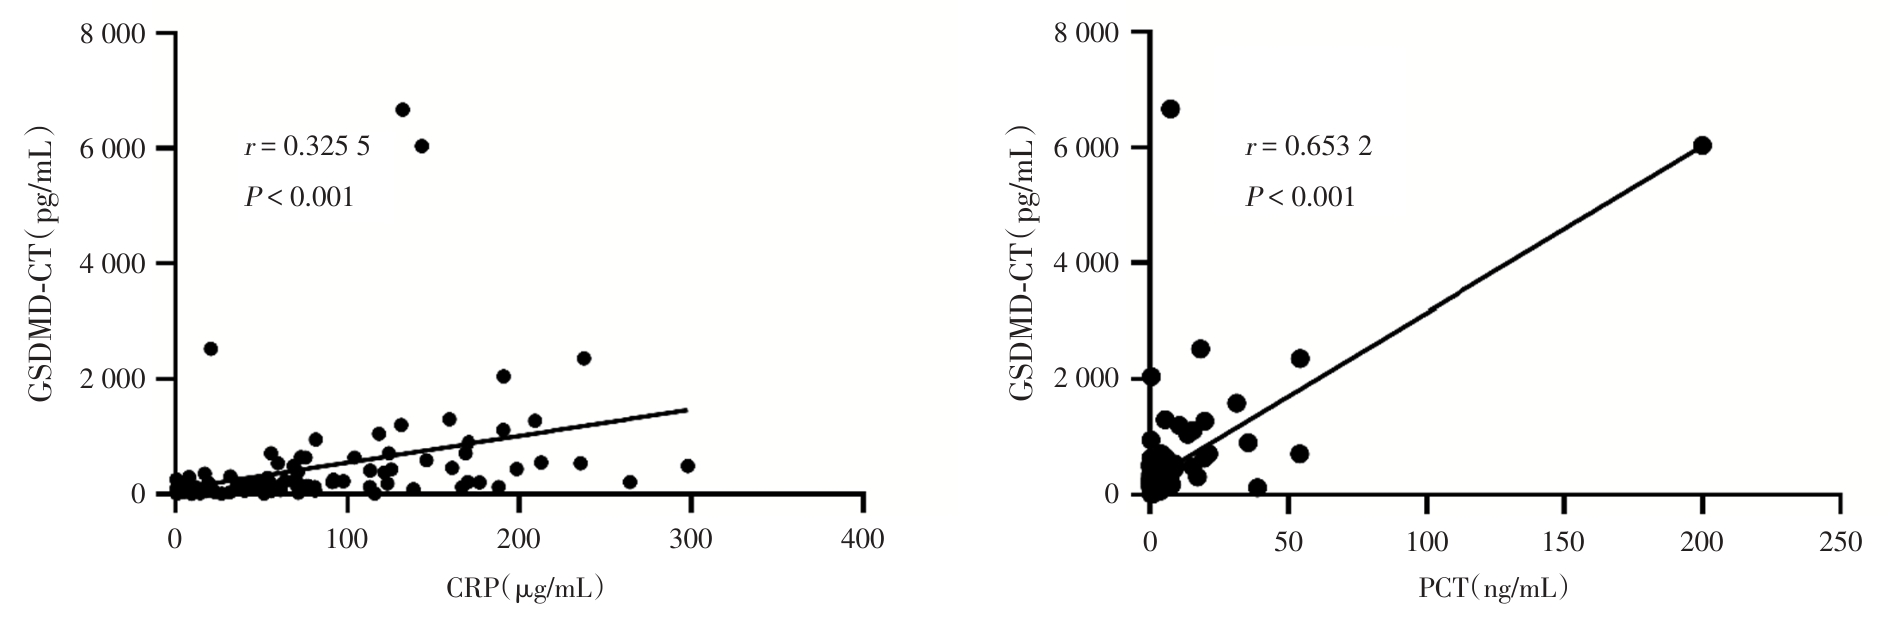
Fig. 6
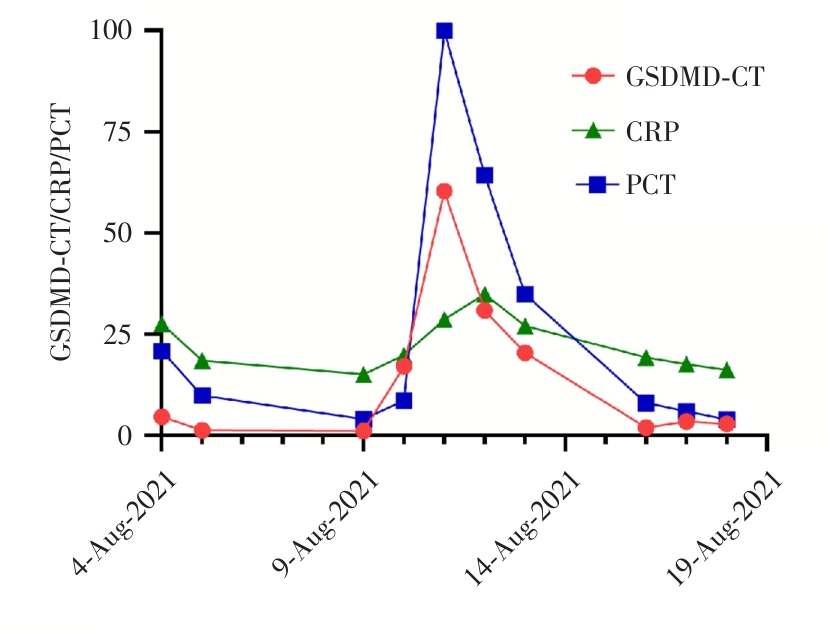
Continuously monitoring the changes in the expression levels of GSDMD-CT, CRP, and PCT"
| 1 | EVANS L, RHODES A, ALHAZZANI W, et al. Executive Summary: Surviving Sepsis Campaign: International Guidelines for the Management of Sepsis and Septic Shock[J].Crit Care Med, 2021, 49(11): 1974-1982. |
| 2 | 蔡兴, 马兴龙, 周长健, 等. 巨噬细胞糖酵解在脓毒症中的研究进展[J]. 实用医学杂志, 2024, 40(19): 2783-2788. |
| 3 |
RUDD K E, JOHNSON S C, AGESA K M, et al. Global, regional, and national sepsis incidence and mortality, 1990-2017: Analysis for the Global Burden of Disease Study[J]. Lancet. 2020, 395(10219): 200-211. doi:10.1016/s0140-6736(19)32989-7
doi: 10.1016/s0140-6736(19)32989-7 |
| 4 |
SRZIC I, NESEK ADAM V, TUNJIC PEJAK D. Sepsis defnition: What′s new in the treatment guidelines[J]. Acta Clin Croat, 2022, 61():67-72. doi:10.20471/acc.2022.61.s1.11
doi: 10.20471/acc.2022.61.s1.11 |
| 5 | 王仙琦, 张斌, 张琪, 等.基于单细胞测序分析脓毒症早期血小板数量和功能变化[J].实用医学杂志, 2024, 40(9): 1218-1224. |
| 6 | EVANS L, RHODES A, ALHAZZANI W, et al.Surviving sepsis campaign: international guidelines for management of sepsis and septic shock 2021[J]. Intensive Care Med, 2021, 47(11): 1181-1247. |
| 7 |
HE R R, YUE G L, DONG M L, et al. SepsisBiomarkers: Advancements and Clinical Applications-A Narrative Review[J]. Int J Mol Sci, 2024, 25(16): 9010. doi:10.3390/ijms25169010
doi: 10.3390/ijms25169010 |
| 8 |
PIERRAKOS C, VELISSARIS D, BISDORF M, et al. Biomarkers of Sepsis: Time for a Reappraisal[J]. Crit Care, 2020, 24(1): 287. doi:10.1186/s13054-020-02993-5
doi: 10.1186/s13054-020-02993-5 |
| 9 |
MEIER M A, BRANCHE A, NEESER O L, et al. Procalcitonin-guided antibiotic treatment in patients with positive blood cultures: A patient-level meta-analysis of randomized trials[J]. Clin Infect Dis, 2019, 69(3):388-396. doi:10.1093/cid/ciy917
doi: 10.1093/cid/ciy917 |
| 10 |
PÓVOA P, COELHO L, DAL-PIZZOL F, et al. How to use biomarkers of infection or sepsis at the bedside: Guide to clinicians[J]. Intensive Care Med, 2023, 49(2): 142-153. doi:10.1007/s00134-022-06956-y
doi: 10.1007/s00134-022-06956-y |
| 11 |
HENNING D J, HALL M K, WATSJOLD B K, et al. Interleukin-6 improves infection identification when added to physician judgment during evaluation of potentially septic patients[J]. Am J Emerg Med, 2020, 38(5): 947-952. doi:10.1016/j.ajem.2019.158361
doi: 10.1016/j.ajem.2019.158361 |
| 12 | 谭扬扬, 杨旭凯, 蔡高平, 等.血清淀粉样蛋白A对成人脓毒症诊断价值的Meta分析[J].中国急救医学, 2022,40(1):35-40. |
| 13 |
RAO Z, ZHU Y, YANG P, et al. Pyroptosis in inflammatory diseases and cancer[J]. Theranostics, 2022, 12(9): 4310-4329. doi:10.7150/thno.71086
doi: 10.7150/thno.71086 |
| 14 |
QI X, LUO Y, XIAO M, et al. Mechanisms of alveolar type 2 epithelial cell death during acute lung injury[J]. Stem Cells, 2023, 41(12): 1113-1132. doi:10.1093/stmcls/sxad074
doi: 10.1093/stmcls/sxad074 |
| 15 |
SHAO R, LOU X, XUE J, et al. Review: The role of GSDMD in sepsis[J]. Inflamm Res, 2022, 71(10-11): 1191-1202. doi:10.1007/s00011-022-01624-9
doi: 10.1007/s00011-022-01624-9 |
| 16 |
NONG Y, WEI X, YU D. Infammatory mechanisms and intervention strategies for sepsis-induced myocardial dysfunction[J]. Immun Infamm Dis, 2023, 11(5): e860. doi:10.1002/iid3.860
doi: 10.1002/iid3.860 |
| 17 |
LEVY M M, FINK M P, MARSHALL J C, et al.2001SCCM/ESICM/ACCP/ATS/SIS International Sepsis Definitions Conference[J]. Intensive Care Med, 2003, 31(4): 1250-1256. doi:10.1097/01.ccm.0000050454.01978.3b
doi: 10.1097/01.ccm.0000050454.01978.3b |
| 18 | 曹钰, 柴艳芬, 邓颖, 等. 中国脓毒症/脓毒性休克急诊治疗指南(2018)[J]. 感染、炎症、修复, 2019, 20(1): 3-22. |
| 19 |
XU D, JIANG J, LIU Y, et al.TIMP2 protects against sepsis-associated acute kidney injury by cAMP/NLRP3 axis-mediated pyroptosis[J]. Am J Physiol Cell Physiol, 2024, 326(5): C1353-C1366. doi:10.1152/ajpcell.00577.2023
doi: 10.1152/ajpcell.00577.2023 |
| 20 | 周旻, 杨磊, 卓玉珍, 等. 凉血活血方对脓毒症急性肾损伤小鼠肠道菌群及 NLRP3/caspase-1/GSDMD 焦亡通路的影响[J]. 中华危重病急救医学, 2023, 35(3): 250-255. |
| 21 |
QUIRANT-SÁNCHEZ B, PLANS-GALVÁN O, LUCAS E, et al. HLA-DR Expression on Monocytes and Sepsis Index Are Useful in Predicting Sepsis[J]. Biomedicines, 2023, 11(7): 1836. doi:10.3390/biomedicines11071836
doi: 10.3390/biomedicines11071836 |
| 22 |
ZAKI H A, BENSLIMAN S, BASHIR K, et al. Accuracy of Procalcitonin for Diagnosing Sepsis in Adult Patients Admitted to the Emergency Department: A Systematic Review and Meta-Analysis[J]. Syst Rev, 2024, 13(1): 37. doi:10.1186/s13643-023-02432-w
doi: 10.1186/s13643-023-02432-w |
| 23 | SPROSTON N R, ASHWORTH J J. Role of C-reactive protein at sites of infammation and infection[J]. Front Immunol, 2018, 13(9):754. |
| 24 |
VON DACH E, ALBRICH W C, BRUNEL A S, et al. Efect of Creactive protein-guided antibiotic treatment duration, 7-daytreatment, or 14-day treatment on 30-day clinical failure rate in patients with uncomplicated gram-negative bacteremia: A randomized clinical trial[J]. JAMA, 2020, 323(21):2160-2169. doi:10.1001/jama.2020.6348
doi: 10.1001/jama.2020.6348 |
| 25 |
TAN M, LU Y, JIANG H, et al. The diagnostic accuracy of procalcitonin and C-reactive protein for sepsis:A systematic review and meta-analysis[J]. J Cell Biochem, 2019, 120(4): 5852-5859. doi:10.1002/jcb.27870
doi: 10.1002/jcb.27870 |
| 26 |
LI Z, HE L, LI S, et al. Combination of Procalcitonin and C-reactive Protein Levels in the Early Diagnosis of Bacterial Co-infections in Children with H1N1 Influenza[J]. Influenza Other Respir Viruses, 2019, 13(2): 184-190. doi:10.1111/irv.12621
doi: 10.1111/irv.12621 |
| 27 |
PARLATO M, PHILIPPART F, ROUQUETTE A, et al. Circulating Biomarkers May Be Unable to Detect Infection at the Early Phase of Sepsis in ICU Patients: TheCAPTAIN Prospective Multicenter Cohort Study[J]. Intensive Care Med, 2018, 44(7): 1061-1070. doi:10.1007/s00134-018-5228-3
doi: 10.1007/s00134-018-5228-3 |
| 28 |
XIA S, ZHANG Z, MAGUPALLI V G, et al. Gasdermin D Pore Structure Reveals Preferential Release of Mature Interleukin-1[J]. Nature, 2021, 593(7860):607-611. doi:10.1038/s41586-021-03478-3
doi: 10.1038/s41586-021-03478-3 |
| 29 |
DAI Z, LIU W C, CHEN X Y, et al. Gasdermin D-Mediated Pyroptosis: Mechanisms, Diseases, and Inhibitor[J]. Front Immunol, 2023,14:1178662. doi:10.3389/fimmu.2023.1178662
doi: 10.3389/fimmu.2023.1178662 |
| Viewed | ||||||
|
Full text |
|
|||||
|
Abstract |
|
|||||