实用医学杂志 ›› 2025, Vol. 41 ›› Issue (23): 3717-3722.doi: 10.3969/j.issn.1006-5725.2025.23.013

• 临床研究 • 上一篇    

基于灌注指数动态变化的危重症患者早期预后预测

韦伟1,欧阳珊红1,胡晓静2()   

  1. 1.海南省妇女儿童医学中心新生儿科 (海南 海口 571000 )
    2.复旦大学附属儿科医院新生儿科 (上海 201102 )
  • 收稿日期:2025-08-04 出版日期:2025-12-10 发布日期:2025-12-18
  • 通讯作者: 胡晓静 E-mail:humama2015@126.com
  • 基金资助:
    海南省自然科学基金项目(821RC1132)

Early prognostic prediction study for critically ill neonates based on dynamic changes in perfusion index

Wei WEI1,Shanhong OUYANG1,Xiaojing. HU2()   

  1. *.Department of Neonatology,Hainan Women and Children'S Medical Center,Haikou 571000,Hainan,China
  • Received:2025-08-04 Online:2025-12-10 Published:2025-12-18
  • Contact: Xiaojing. HU E-mail:humama2015@126.com

摘要:

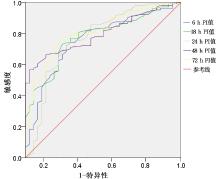
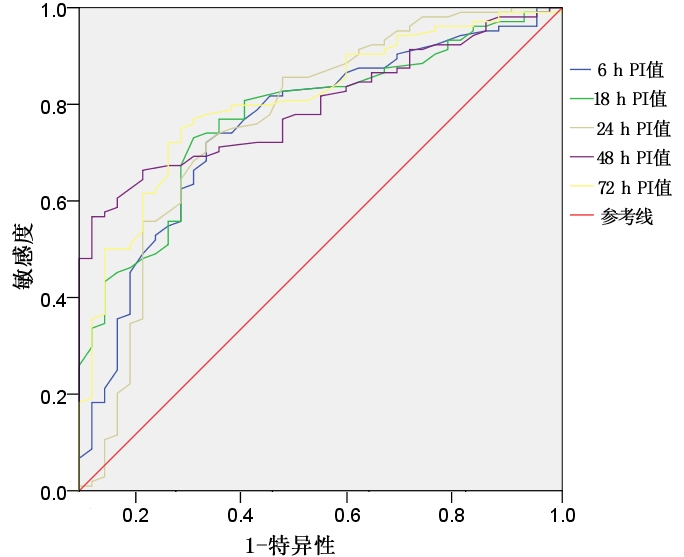
目的 明确健康新生儿灌注指数(PI)参考值范围,并探讨不同时间点(6、18、24、48、72 h)PI值在危重症新生儿预后预测中的价值。 方法 选取2022年7月至2024年9月于海南省妇女儿童医学中心出生的健康新生儿100例及新生儿重症监护病房收治的危重症新生儿142例作为研究对象。健康新生儿作为健康组,危重症新生儿根据危重程度分为低危重组(44例),中危重组(61例),高危重组(37例)。记录142例危重症患儿预后情况,并分为预后不良组(38例)和预后良好组(104例)。监测新生儿出生后6 ~ 72 h的PI值。采用Spearman分析评估危重新生儿危重程度与出生后6 ~ 72 h的PI值的相关性,采用logistic回归分析出生后6 ~ 72 h的PI值与危重症新生儿预后的关系。采用受试者工作特征(ROC)曲线分析PI值预测危重症新生儿预后不良的价值,并确定PI预测预后的阈值。 结果 健康新生儿出生后6 ~ 72 h内PI值范围为2.61 ~ 3.31。危重组新生儿出生后6 ~ 72 h PI值均低于健康组,且不同危重程度新生儿6 ~ 72 h PI值差异均有统计学意义(P < 0.05)。各组新生儿出生后72 h内PI值均逐渐增高(P < 0.05)。危重症新生儿危重程度与出生后6、18、24、48、72 h的PI值均呈负相关(P < 0.05)。预后不良组新生儿出生后6 ~ 72 h PI值均低于预后良好组(P < 0.05)。PI值降低与危重症新生儿预后不良相关(P < 0.05)。出生后6、18、24、48、72 h的PI值预测危重症新生儿预后不良的曲线下面积(AUC)分别为0.760、0.779、0.768、0.797、0.808,截断值分别为0.88、1.12、1.25、1.65、1.82。 结论 新生儿出生后6 ~ 72 h PI值与疾病危重程度相关,PI值降低与预后不良相关,危重症新生儿出生后6 ~ 72 h PI值对预后具有辅助预测价值。

关键词: 外周灌注指数, 危重症新生儿, 预测价值

Abstract:

Objective The reference range for perfusion index (PI) in healthy newborns was established, and the prognostic value of PI at multiple time points (6 h, 18 h, 24 h, 48 h, and 72 h) in critically ill newborns was evaluated. Methods A total of 100 healthy neonates born at the Hainan Women and Children's Medical Center between July 2022 and September 2024, along with 142 critically ill neonates admitted to the neonatal intensive care unit, were enrolled as study participants. The healthy neonates constituted the control group, while the critically ill neonates were categorized into low-risk (n = 44), medium-risk (n = 61), and high-risk (n = 37) groups according to disease severity. The clinical outcomes of the critically ill neonates were recorded and classified into poor prognosis (n = 38) and good prognosis (n = 104) groups. PI values were monitored in all neonates from 6 to 72 hours after birth. Spearman correlation analysis was performed to assess the association between illness severity and PI values during this period, while logistic regression analysis was employed to examine the relationship between PI values and prognosis in critically ill neonates. Receiver operating characteristic (ROC) curve analysis was conducted to evaluate the predictive value of PI for poor prognosis, and the optimal cutoff threshold for prognosis prediction was determined. Results The PI values of healthy neonates between 6 and 72 hours after birth ranged from 2.61 to 3.31. Critically ill neonates exhibited consistently lower PI values than their healthy counterparts during the same period, with statistically significant differences observed across neonates of varying illness severity (P < 0.05). PI values in all groups gradually increased within the first 72 hours post-birth (P < 0.05). Neonatal illness severity was negatively correlated with PI values measured at 6, 18, 24, 48, and 72 hours after birth (P < 0.05). Furthermore, neonates in the poor prognosis group had significantly lower PI values between 6 and 72 hours compared to those in the good prognosis group (P < 0.05). Reduced PI values were significantly associated with an increased risk of poor prognosis in critically ill neonates (P < 0.05). The predictive performance of PI values for poor prognosis, as assessed by the area under the curve (AUC), yielded values of 0.760, 0.779, 0.768, 0.797, and 0.808 at 6, 18, 24, 48, and 72 hours, respectively, with corresponding cut-off values of 0.88, 1.12, 1.25, 1.65, and 1.82. Conclusion The PI values measured between 6 and 72 hours after birth are closely associated with disease severity in neonates, with lower PI values indicating a poorer prognosis. These early postnatal PI measurements demonstrate auxiliary predictive value for the outcomes of critically ill neonates.

Key words: perioperative perfusion index, critically ill newborns, predictive value

中图分类号: