

The Journal of Practical Medicine ›› 2025, Vol. 41 ›› Issue (5): 691-698.doi: 10.3969/j.issn.1006-5725.2025.05.011
• Clinical Research • Previous Articles
Qiaoying MO,Fangyi ZHU( ),Cunkui ZHU,Shenglong. MA
Received:2024-10-24
Online:2025-03-10
Published:2025-03-20
Contact:
Fangyi ZHU
E-mail:3563986189@qq.com
CLC Number:
Qiaoying MO,Fangyi ZHU,Cunkui ZHU,Shenglong. MA. Nomogram model of malnutrition risk in patients suffering from chronic heart failure grounded on GNRI score[J]. The Journal of Practical Medicine, 2025, 41(5): 691-698.
Tab.1
Analysis of the clinical information of individuals with chronic heart failure"
| 指标 | 营养正常组(n = 138) | 营养不良组(n = 321) | χ2/t/Z值 | P值 |
|---|---|---|---|---|
| 年龄(x ± s)/岁 | 66.99 ± 15.34 | 69.23 ± 16.49 | -1.401 | 0.162 |
| 性别/[例(%)] | 0.129 | 0.719 | ||
| 男 | 66 | 146 | ||
| 女 | 72 | 175 | ||
| 身高(x ± s)/cm | 166.64 ± 8.09 | 166.96 ± 9.56 | -0.361 | 0.718 |
| 体质量(x ± s)/kg | 69.23 ± 11.5 | 63.47 ± 11.5 | 4.920 | 0.000 |
| 高血压/[例(%)] | 67(48.55) | 168(52.5) | 1.034 | 0.596 |
| 糖尿病/[例(%)] | 21(15.22) | 64(19.94) | 1.129 | 0.288 |
| 冠心病/[例(%)] | 27(19.57) | 70(21.81) | 0.172 | 0.678 |
| 白细胞计数/(× 109/L) | 6.09(5.20,7.37) | 5.83(4.79,7.32) | 10.070 | 0.125 |
| 中性粒细胞/(× 109/L) | 3.93(3.32,5.2) | 3.91(3.18,4.96) | 10.460 | 0.494 |
| 淋巴细胞计数/(× 109/L) | 1.44(1.06,1.90) | 1.18(0.84,1.60) | 9.046 | 0.000 |
| 单核细胞计数/(× 109/L) | 0.46(0.38,0.58) | 0.49(0.37,0.64) | 11.221 | 0.329 |
| 红细胞计数/(× 1012/L) | 5.02(4.54,5.48) | 4.92(4.38,5.61) | 10.405 | 0.421 |
| 血红蛋白(x ± s)/(g/L) | 153.80 ± 23.16 | 151.46 ± 29.31 | 0.915 | 0.361 |
| 红细胞分布宽度(x ± s)/(fL) | 50.25 ± 6.74 | 54.14 ± 9.00 | -5.091 | 0.000 |
| 血小板计数/(×109/L) | 161(134,203) | 155(123,201) | 10.321 | 0.323 |
| 尿素氮/(mmol/L) | 6.85(5.29,8.42) | 7.70(5.88,10.29) | 12.203 | 0.002 |
| 肌酐/(μmol/L) | 78(66,92) | 84(68,105) | 11.867 | 0.017 |
| 尿酸/(μmol/L) | 384(318,481) | 416(323,522) | 11.857 | 0.018 |
| 白蛋白/(g/L) | 40.6(39.2,42.7) | 34.8(31.5,36.7) | 3.158 | 0.000 |
| 总胆红素/(μmol/L) | 19.0(15.5,28.0) | 19.8(14.0,29.3) | 10.653 | 0.792 |
| 直接胆红素/(μmol/L) | 7.5(5.5,10.0) | 8.0(5.6,11.4) | 11.357 | 0.204 |
| 间接胆红素/(μmol/L) | 12.5(9.3,17.8) | 12.0(8.0,16.5) | 10.058 | 0.118 |
| γ-谷氨酰胺转肽酶/(U/L) | 45(30,78) | 47(28,83) | 10.871 | 0.833 |
| 总胆固醇(x ± s)/(mmol/L) | 4.17 ± 1.04 | 3.42 ± 0.97 | 7.233 | 0.000 |
| 甘油三酯(x ± s)/(mmol/L) | 1.57 ± 0.95 | 1.25 ± 0.70 | 3.550 | 0.000 |
| HDL-L(x ± s)/(mmol/L) | 1.08 ± 0.26 | 0.91 ± 0.27 | 6.270 | 0.000 |
| LDL-L(x ± s)/(mmol/L) | 2.52 ± 0.95 | 2.01 ± 0.76 | 5.534 | 0.000 |
| 载脂蛋白A1(x ± s)/(g/L) | 1.14 ± 0.23 | 0.94 ± 0.41 | 6.633 | 0.000 |
| 载脂蛋白B(x ± s)/(g/L) | 0.76 ± 0.26 | 0.63 ± 0.22 | 5.106 | 0.000 |
| 脂蛋白(a)/(mg/L) | 166.2(114.4,288.0) | 206.0(123.6,314.0) | 11.428 | 0.154 |
| 同型半胱氨酸/(μmol/L) | 14.78(13.12,20.60) | 17.09(13.41,23.19) | 11.647 | 0.057 |
| NT-proBNP/(pg/mL) | 2 328(925,4 570) | 4 393(2 142,9 182) | 13.374 | 0.000 |
| 纤维蛋白原/(g/L) | 2.69(2.28,3.44) | 2.84(2.25,3.60) | 11.009 | 0.608 |
| 纤维蛋白降解产物/(μg/mL) | 1.74(1.12,3.05) | 3.28(1.74,6.77) | 13.628 | 0.000 |
| D-二聚体/(μg/mL) | 0.39(0.20,0.77) | 0.79(0.39,1.76) | 13.607 | 0.000 |
| CRP/(mg/L) | 5.36(3.31,12.78) | 8.79(4.04,22.53) | 12.455 | 0.000 |
| 降钙素原/(ng/mL) | 0.05(0.03,0.08) | 0.06(0.04,0.12) | 12.410 | 0.001 |
| IL-6/(pg/mL) | 5.7(2.1,11.3) | 10.9(4.8,21.3) | 12.994 | 0.000 |
| LVEF/% | 43(31,52) | 40(28,55) | 10.182 | 0.196 |
| SSS(x ± s)/分 | 31.17 ± 7.20 | 34.39 ± 8.02 | -4.241 | 0.000 |
| GAD-7(x ± s)/分 | 3.86 ± 4.06 | 5.23 ± 4.23 | -3.276 | 0.001 |
| PHQ-9(x ± s)/分 | 4.56 ± 3.98 | 5.95 ± 4.26 | -3.359 | 0.001 |
Tab.2
Multivariate logistic analysis on the risk of malnutrition in patients with chronic heart failure"
| 变量 | 回归系数 | Se | z统计量 | OR(95%CI) | P值 |
|---|---|---|---|---|---|
| 体质量 | -0.167 | 0.038 | -4.365 | 0.8463(0.7852 ~ 0.9121) | 0.000 |
| GAD-7 | 0.174 | 0.078 | 2.236 | 1.1902(1.0217 ~ 1.3865) | 0.025 |
| 尿素氮 | 0.395 | 0.144 | 2.738 | 1.4842(1.1187 ~ 1.9691) | 0.006 |
| 尿酸 | -0.006 | 0.003 | -1.834 | 0.9944(0.9885 ~ 1.0004) | 0.067 |
| 白蛋白 | -3.064 | 0.510 | -6.013 | 0.0467(0.0172 ~ 0.1268) | 0.000 |
| 总胆固醇 | 1.541 | 1.108 | 1.391 | 4.6705(0.5322 ~ 40.9879) | 0.164 |
| HDL-L | -3.195 | 1.762 | -1.814 | 0.041(0.0013 ~ 1.2933) | 0.070 |
| LDL-L | -1.717 | 1.068 | -1.607 | 0.1797(0.0221 ~ 1.4588) | 0.108 |
| D-二聚体 | -0.415 | 0.302 | -1.372 | 0.6606(0.3653 ~ 1.1946) | 0.170 |
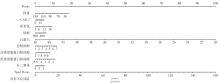
Fig.1
A nomogram model for assessing the risk of malnutrition in patients with chronic heart failure"
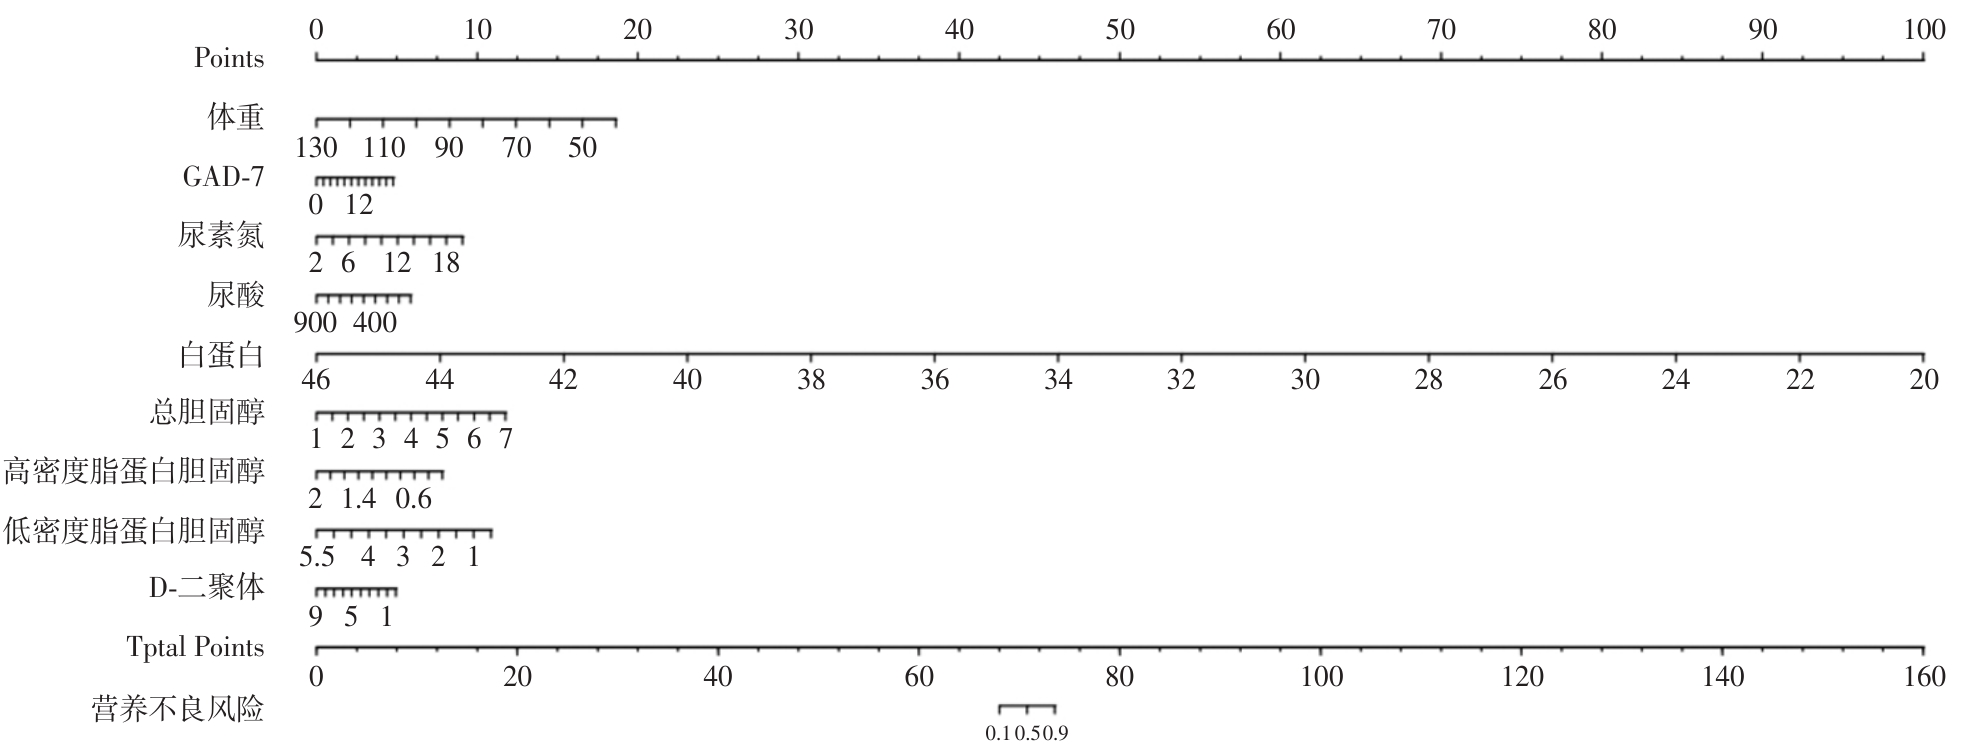
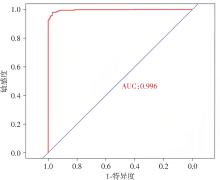
Fig.2
The ROC curve of the nomogram model for malnutrition in patients with chronic heart failure"
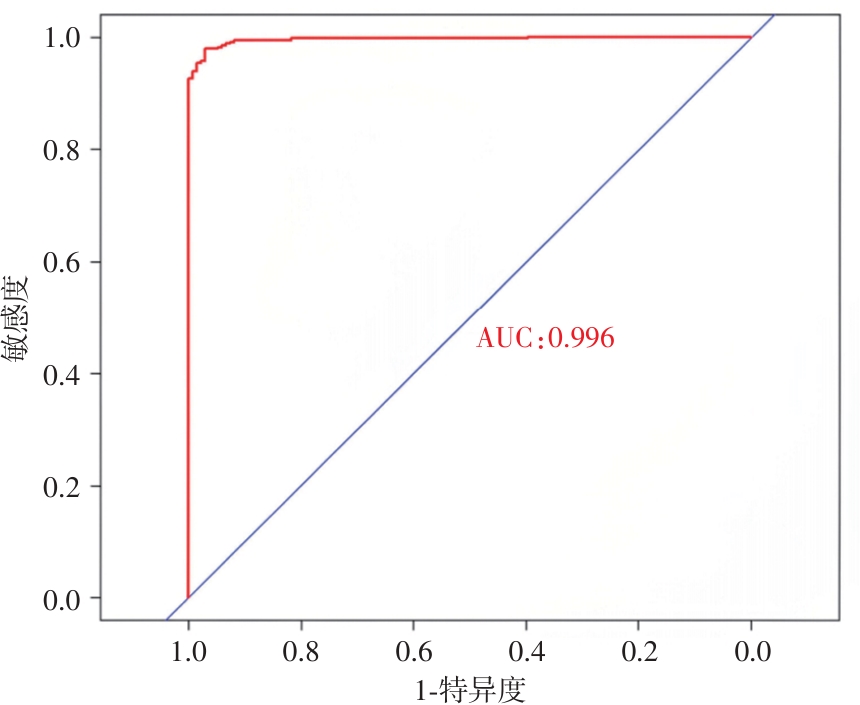
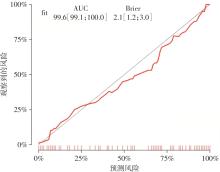
Fig.3
Calibration curve of the dystrophy nomogram model for chronic heart failure patients"
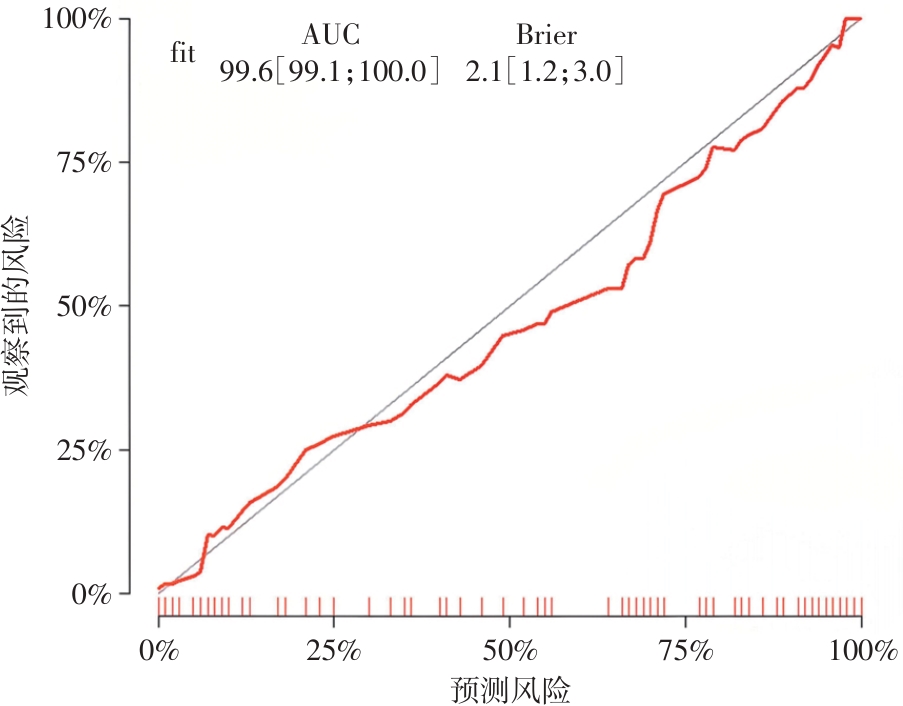

Fig.4
Calibration curve of malnutrition risk model probability in chronic heart failure patients"
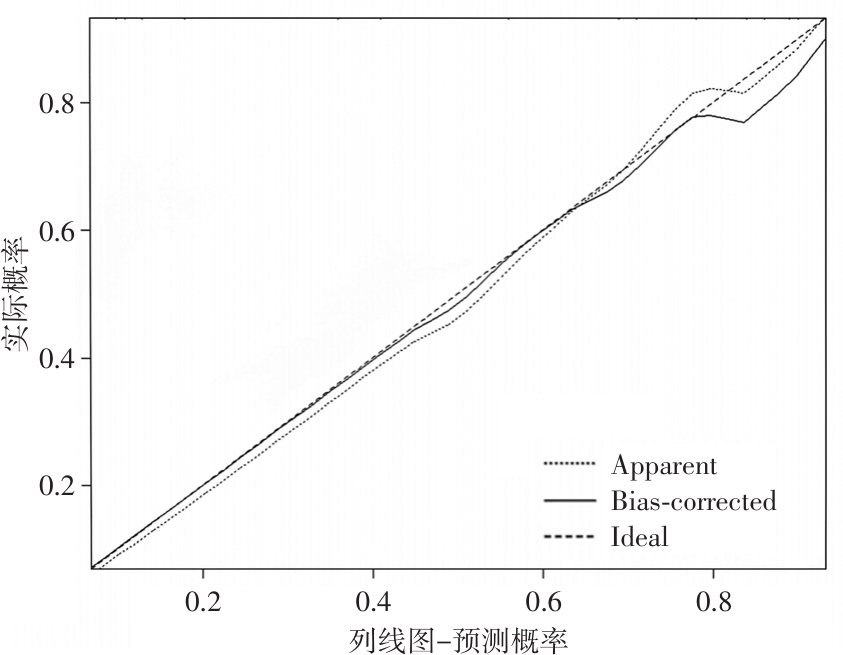
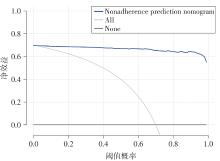
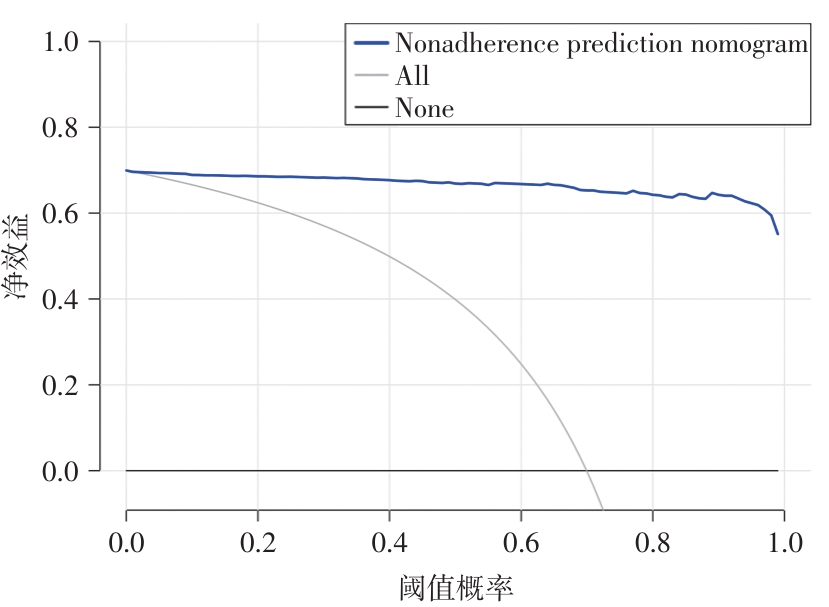
Fig.5
Decision curve of the malnutrition prediction risk model for patients with chronic heart failure"
| 1 |
GRANATA N, TORLASCHI V, ZANATTA F, et al. Positive affect as a predictor of non-pharmacological adherence in older Chronic Heart Failure (CHF) patients undergoing cardiac rehabilitation[J]. Psychol Health Med, 2023, 28(3): 606-620. doi:10.1080/13548506.2022.2077394
doi: 10.1080/13548506.2022.2077394 |
| 2 |
NGUYEN D D, SPERTUS J A, ALEXANDER K P, et al. Health status and clinical outcomes in older adults with chronic coronary disease: THE ISCHEMIA trial[J]. J Am Coll Cardiol, 2023, 81(17): 1697-1709. doi:10.1016/j.jacc.2023.02.048
doi: 10.1016/j.jacc.2023.02.048 |
| 3 | 国家心血管病中心, 国家心血管病专家委员会心力衰竭专业委员会, 中国医师协会心力衰竭专业委员会, 等. 国家心力衰竭指南2023[J]. 中华心力衰竭和心肌病杂志, 2023, 7(4): 215-311. |
| 4 |
骆骏骞, 邓志文, 黎土娣, 等. 心力衰竭的治疗进展[J]. 实用医学杂志, 2022, 38(10): 1181-1186. doi:10.3969/j.issn.1006-5725.2022.10.002
doi: 10.3969/j.issn.1006-5725.2022.10.002 |
| 5 |
DRIGGIN E, COHEN L P, GALLAGHER D, et al. Nutrition assessment and dietary interventions in heart failure: JACC review topic of the week[J]. J Am Coll Cardiol, 2022, 79(16): 1623-1635. doi:10.1016/j.jacc.2022.02.025
doi: 10.1016/j.jacc.2022.02.025 |
| 6 |
RUSLI C, BUKHARI A, N A T, et al. Nutrition therapy in critically ill overweight elderly patient with heart failure, myocardial infarction, pneumonia, and chronic kidney disease[J]. J Nutr Sci Vitaminol (Tokyo), 2020, 66: S25-S31. doi:10.3177/jnsv.66.s25
doi: 10.3177/jnsv.66.s25 |
| 7 |
TSABEDZE N, KINSEY J H, MPANYA D, et al. The prevalence of depression, stress and anxiety symptoms in patients with chronic heart failure[J]. Int J Ment Health Syst, 2021, 15(1): 44. doi:10.1186/s13033-021-00467-x
doi: 10.1186/s13033-021-00467-x |
| 8 |
中华医学会心血管病学分会心力衰竭学组, 中国医师协会心力衰竭专业委员会, 中华心血管病杂志编辑委员会. 中国心力衰竭诊断和治疗指南2018[J]. 中华心血管病杂志, 2018, 46(10): 760-789. doi:10.3760/cma.j.issn.0253-3758.2018.10.004
doi: 10.3760/cma.j.issn.0253-3758.2018.10.004 |
| 9 |
CHEN Z Q, HAO Q S, SUN R, et al. Predictive value of the geriatric nutrition risk index for postoperative delirium in elderly patients undergoing cardiac surgery[J]. CNS Neurosci Ther, 2024, 30(2): e14343. doi:10.1111/cns.14343
doi: 10.1111/cns.14343 |
| 10 |
DAI X Y, YU D J. Analysis of mental health status before and after psychological intervention in response to public health emergencies by medical students: A prospective single-arm clinical trial[J]. Transl Pediatr, 2023, 12(3): 462-469. doi:10.21037/tp-23-120
doi: 10.21037/tp-23-120 |
| 11 |
KROENKE K, SPITZER R L, WILLIAMS J B. The PHQ-9: Validity of a brief depression severity measure[J]. J Gen Intern Med, 2001, 16(9): 606-613. doi:10.1046/j.1525-1497.2001.016009606.x
doi: 10.1046/j.1525-1497.2001.016009606.x |
| 12 |
PHEH K S, TAN C S, LEE K W, et al. Factorial structure, reliability, and construct validity of the Generalized Anxiety Disorder 7-item (GAD-7): Evidence from Malaysia[J]. PLoS One, 2023, 18(5): e0285435. doi:10.1371/journal.pone.0285435
doi: 10.1371/journal.pone.0285435 |
| 13 |
VESKOVIC J, CVETKOVIC M, TAHIROVIC E, et al. Depression, anxiety, and quality of life as predictors of rehospitalization in patients with chronic heart failure[J]. BMC Cardiovasc Disord, 2023, 23(1): 525. doi:10.1186/s12872-023-03500-8
doi: 10.1186/s12872-023-03500-8 |
| 14 |
BERNARDES S, TEIXEIRA P J Z, SILVA F M. Association of reduced BMI, length of hospital stay, mortality, and malnutrition diagnosis in patients with acute exacerbation COPD: A secondary analysis of a cohort study[J]. JPEN J Parenter Enteral Nutr, 2023, 47(1): 101-108. doi:10.1002/jpen.2390
doi: 10.1002/jpen.2390 |
| 15 |
MAO Z, WEN T, LIU X L, et al. Geriatric nutritional risk index is associated with hospital death in elderly patients with multiple organ dysfunction syndrome: A retrospective study based on the MIMIC-III databas[J]. Front Nutr, 2022, 9: 834256. doi:10.3389/fnut.2022.834256
doi: 10.3389/fnut.2022.834256 |
| 16 |
YENIBERTIZ D, CIRIK M O. The comparison of GNRI and other nutritional indexes on short-term survival in geriatric patients treated for respiratory failure[J]. Aging Clin Exp Res, 2021, 33(3): 611-617. doi:10.1007/s40520-020-01740-8
doi: 10.1007/s40520-020-01740-8 |
| 17 |
PAGNESI M, SERAFINI L, CHIARITO M, et al. Impact of malnutrition in patients with severe heart failure[J]. Eur J Heart Fail, 2024, 26(7): 1585-1593. doi:10.1002/ejhf.3285
doi: 10.1002/ejhf.3285 |
| 18 |
CZAPLA M, SURMA S, KWASNY A, et al. Association of Body Mass Index with outcomes in patients with heart failure with reduced ejection fraction (HFrEF)[J]. Nutrients, 2024, 16(15): 2473. doi:10.3390/nu16152473
doi: 10.3390/nu16152473 |
| 19 |
YANG X M, LI Q M, GAO Q N. Effect of high-quality nursing intervention on anxiety and depression in patients with chronic heart failure companied malnutrition: A protocol for systematic review and meta-analysis[J]. Medicine (Baltimore), 2020, 99(22): e20261. doi:10.1097/md.0000000000020261
doi: 10.1097/md.0000000000020261 |
| 20 | 李雯曦, 刘国顺, 彭程, 等. 老年慢性心衰患者抑郁焦虑状态与血清炎症标志物的相关性[J]. 中华神经医学杂志, 2020, 19(12): 1228-1234. |
| 21 | 孙媛, 赵黎, 阎艳. 慢性心力衰竭患者焦虑抑郁与营养睡眠质量状况及其相关性分析[J]. 山西医药杂志, 2019, 48(14): 1697-1699. |
| 22 |
SALVIOLI B, PELLEGATTA G, MALACARNE M, et al. Autonomic nervous system dysregulation in irritable bowel syndrome[J]. Neurogastroenterol Motil, 2015, 27(3): 423-430. doi:10.1111/nmo.12512
doi: 10.1111/nmo.12512 |
| 23 |
ANDREAE C, STROMBERG A, ARESTEDT K. Prevalence and associated factors for decreased appetite among patients with stable heart failure[J]. J Clin Nurs, 2016, 25(11/12): 1703-1712. doi:10.1111/jocn.13220
doi: 10.1111/jocn.13220 |
| 24 |
JOHAL J, HAN C Y, JOSEPH R, et al. Dietary supplements in people with metastatic cancer who are experiencing malnutrition, cachexia, sarcopenia, and frailty: A scoping review[J]. Nutrients, 2022, 14(13): 2642. doi:10.3390/nu14132642
doi: 10.3390/nu14132642 |
| 25 |
ZOU Y F, SONG X J, LIU N, et al. Intestinal flora: A potential new regulator of cardiovascular disease[J]. Aging Dis, 2022, 13(3): 753-772. doi:10.14336/ad.2021.1022
doi: 10.14336/ad.2021.1022 |
| 26 | 曹选超, 杨新颖, 王心慧, 等. 老年慢性心力衰竭患者情绪障碍与免疫功能的相关性研究[J]. 中国循证心血管医学杂志, 2023, 15(9): 1085-1088. |
| 27 |
龙珊, 刘兴德, 李甜甜, 等. 冠心病患者经皮冠状动脉介入治疗术后合并焦虑抑郁机制及治疗的研究进展[J]. 实用医学杂志, 2023, 39(21): 2850-2856. doi:10.3969/j.issn.1006-5725.2023.21.026
doi: 10.3969/j.issn.1006-5725.2023.21.026 |
| 28 | 王小红, 王丽. 不同射血分数心力衰竭患者黄嘌呤氧化酶与尿酸的表达及意义[J]. 实用医学杂志, 2022, 38(10): 1231-1235. |
| 29 | 郝红梅, 黄海玲, 张微, 等. 慢性心力衰竭患者营养不良风险列线图预测模型的构建与验证[J]. 现代预防医学, 2022, 49(17): 3130-3135. |
| 30 |
JINGI A M, NKOKE C, NOUBIAP J J, et al. Prevalence, correlates and in-hospital outcomes of kidney dysfunction in hospitalized patients with heart failure in Buea-Cameroon[J]. BMC Nephrol, 2022, 23(1): 8. doi:10.1186/s12882-021-02641-2
doi: 10.1186/s12882-021-02641-2 |
| 31 |
LING S, XU J W. NETosis as a pathogenic factor for heart failure[J]. Oxid Med Cell Longev, 2021, 2021: 6687096. doi:10.1155/2021/6687096
doi: 10.1155/2021/6687096 |
| 32 |
SZE S, PELLICORI P, KAZMI S, et al. Prevalence and prognostic significance of malnutrition using 3 scoring systems among outpatients with heart failure: A comparison with body mass index[J]. JACC Heart Fail, 2018, 6(6): 476-486. doi:10.1016/j.jchf.2018.02.018
doi: 10.1016/j.jchf.2018.02.018 |
| 33 |
ESTEBAN-FERNANDEZ A, VILLAR-TAIBO R, ALEJO M, et al. Diagnosis and management of malnutrition in patients with heart failure[J]. J Clin Med, 2023, 12(9): 3320. doi:10.3390/jcm12093320
doi: 10.3390/jcm12093320 |
| 34 |
MONGIRDIENE A, LAUKAITIENE J, SKIPSKIS V, et al. Platelet activity and its correlation with inflammation and cell count readings in chronic heart failure patients with reduced ejection fraction[J]. Medicina (Kaunas), 2021, 57(2): 176. doi:10.3390/medicina57020176
doi: 10.3390/medicina57020176 |
| [1] | Dongli LIU,Zilin QUAN,Lingxiu ZHONG,Qiqi CHEN,Wenqiao CAI,Senpei ZHUANG,Ying WEI,Huiyi PAN,Yawen. LIN. Construction and validation of a predictive model for antibiotic-associated diarrhea after surgery in children with congenital heart disease [J]. The Journal of Practical Medicine, 2025, 41(5): 683-690. |
| [2] | Qingqing WANG,Jie DING,Haiwen LI,Zhijian DONG,Yiying WANG,Siqi LIU,Guoji CHANG,Lijuan HUA,Huayi CHEN,Shenghao LI,Yongrui. YANG. Analysis of factors influencing short⁃term adverse clinical outcome in cirrhotic patients with grade 2/3 ascites [J]. The Journal of Practical Medicine, 2024, 40(8): 1114-1120. |
| [3] | Xiaotong LIU,Xianhua SU,Zhijun XIN,Fengqiong GAO,Jiayi FENG,Tongxia. XIA. Risk factors of postoperative complications in patients with spinal tuberculosis and the predictive value of prognostic nutritional index [J]. The Journal of Practical Medicine, 2024, 40(7): 972-978. |
| [4] | Changzhi GUO,Tao SUN,Shuman HAN,Lingxiang WANG,Mengjing. NIU. Risk factors of peripheral infections of knee joint tumor prosthesis and predictive value of serum D⁃dimer and TLR2 [J]. The Journal of Practical Medicine, 2024, 40(6): 814-819. |
| [5] | Xilin WANG,Chanjuan YANG,Daomeng. CHENG. Construction of a nomogram prediction model for aggressive behavior in patients with bipolar disorder [J]. The Journal of Practical Medicine, 2024, 40(5): 677-681. |
| [6] | Wenjie HAN,Youtian ZHOU,Zhensheng LI,Jianjie KANG,Bingmei. DENG. Risk factors of depression and anxiety in epilepsy patients and their relationship with quality of life [J]. The Journal of Practical Medicine, 2024, 40(4): 460-465. |
| [7] | Hanzhi DAI,Sheng ZHANG,Ronghai. LIN. The latest developments in nutritional therapy pathways for patients in critical condition [J]. The Journal of Practical Medicine, 2024, 40(4): 585-590. |
| [8] | Huiqun WANG,Chao YE,Chao XU,Si CHEN,Kaiguang ZHANG,Mei. XIAO. A 5⁃year follow⁃up study of rebleeding after endoscopic treatment of esophageal gastric varices rebleeding associated with liver cirrhosis [J]. The Journal of Practical Medicine, 2024, 40(22): 3155-3159. |
| [9] | Shijun LUO,Lizi ZHANG,Dunjin. CHEN. Diagnosis, prevention and treatment of placenta accreta spectrum with non⁃traumatic factors [J]. The Journal of Practical Medicine, 2024, 40(21): 2971-2975. |
| [10] | Lili TANG,Xueming LI,Liming LEI,Xiaodong ZENG,Yun LING,Qiongyu LIN,Sumin. ZHU. Risk factors for prolonged ICU stay after surgery in patients with infective endocarditis [J]. The Journal of Practical Medicine, 2024, 40(20): 2854-2859. |
| [11] | Xing HU,Qingrong LI,Jiang LI,Wei HE,Ping′an HE,Mei LV,Xu. YANG. The Nomogram model was established for the risk assessment of intestinal colonization with neonatal CRKP [J]. The Journal of Practical Medicine, 2024, 40(2): 231-236. |
| [12] | Xianghong CHEN,Xiumin CHEN,Yingyan ZHOU,Li LI,Zhenxiong. XU. Advancements in the investigation of cardiovascular risk associated with idiopathic inflammatory myopathy [J]. The Journal of Practical Medicine, 2024, 40(19): 2801-2805. |
| [13] | Hongmei LIU,Huahong ZHOU,Xiangjiu CHEN,Guobao HONG,Xiongbin WU,Yanjuan LIANG,Chunting LI,Meidi ZHENG,Yueqin LAI,Fanna. LIU. Association of frailty with anxiety and depression in patients on maintenance hemodialysis [J]. The Journal of Practical Medicine, 2024, 40(18): 2612-2617. |
| [14] | Yalin YANG,Yang HU,Yunhong WEI,Jie DENG,Yu. WANG. Application value and progress of heart rate recovery in indication of cardiovascular diseases [J]. The Journal of Practical Medicine, 2024, 40(18): 2660-2664. |
| [15] | Jun ZHENG,Qiye WU,Xia ZENG,Zhixian LEI,Dufei. ZHANG. Clinical characteristics and risk factors of the occurrence of hypoxic hepatitis in children with shock [J]. The Journal of Practical Medicine, 2024, 40(15): 2126-2132. |
| Viewed | ||||||
|
Full text |
|
|||||
|
Abstract |
|
|||||