

The Journal of Practical Medicine ›› 2025, Vol. 41 ›› Issue (8): 1192-1198.doi: 10.3969/j.issn.1006-5725.2025.08.015
• Clinical Research • Previous Articles
Qian NIE1,Xuemei ZHANG2,Zhihua HAO3,Ruolin XIE1,Huanxin LIU1,Xiaoqian WU1,Luping. REN4
Received:2024-12-01
Online:2025-04-25
Published:2025-04-30
CLC Number:
Qian NIE,Xuemei ZHANG,Zhihua HAO,Ruolin XIE,Huanxin LIU,Xiaoqian WU,Luping. REN. The comparative study of TyG and TyG⁃BMI index with occurrence of hyperuricemia in physical examination population[J]. The Journal of Practical Medicine, 2025, 41(8): 1192-1198.
Tab.1
Basic characteristics of the enrolled population"
| 组别 | 例数 | 男性/例 | 年龄/岁 | 腰围/cm | BMI/(kg/m2) |
|---|---|---|---|---|---|
| 正常组 | 9 952 | 5 340 | 46.30 ± 13.40 | 83.75 ± 10.58 | 23.91 ± 3.43 |
| HUA组 | 2 052 | 1 999 | 43.39 ± 12.85 | 93.21 ± 17.74 | 26.62 ± 3.37 |
| t值 | - | - | 9.21 | -23.14 | -32.66 |
| P值 | - | - | < 0.001 | < 0.001 | < 0.001 |
| 组别 | Cr/(μmol/L) | BUN/(mmol/L) | FBG/(mmol/L) | TG/(mmol/L) | TC/(mmol/L) |
| 正常组 | 74.22 ± 11.58 | 4.64 ± 1.14 | 5.50 ± 1.76 | 1.40 ± 1.03 | 4.97 ± 0.95 |
| HUA组 | 85.19 ± 9.80 | 5.01 ± 1.08 | 5.58 ± 1.03 | 2.15 ± 1.64 | 5.18 ± 0.98 |
| t值 | -45.60 | -13.54 | -2.90 | -27.47 | -8.92 |
| P值 | < 0.01 | < 0.001 | < 0.001 | < 0.001 | < 0.001 |
| 组别 | HDL-C/(mmol/L) | LDL-C/(mmol/L) | SUA/(μmol/L) | TyG | TyG-BMI |
| 正常组 | 1.30 ± 0.29 | 3.00 ± 0.68 | 307.97 ± 62.24 | 8.55 ± 0.58 | 205.58 ± 40.21 |
| HUA组 | 1.14 ± 0.24 | 3.21 ± 0.67 | 475.90 ± 50.36 | 9.98 ± 0.62 | 239.59 ± 40.19 |
| t值 | 24.61 | -12.30 | -134.87 | -29.16 | |
| P值 | < 0.001 | < 0.001 | < 0.001 | < 0.001 | < 0.001 |
Tab.2
Comparison of the incidence of different subgroups of HUA"
| 亚组 | SUA/(μmol/L) | F值 | P值 | 正常组/例 | HUA组/例 | HUA患病率/% | χ2 值 | P值 |
|---|---|---|---|---|---|---|---|---|
| TyG | 635.92 | < 0.001 | 774.79 | < 0.001 | ||||
| Q1 | 293.32 ± 73.84 | 2 824 | 177 | 5.90 | ||||
| Q2 | 322.14 ± 80.43 | 2 657 | 343 | 11.43 | ||||
| Q3 | 350.10 ± 81.98 | 2 417 | 584 | 19.46 | ||||
| Q4 | 380.81 ± 87.41 | 2 054 | 948 | 31.58 | ||||
| TyG-BMI | 1 088.49 | < 0.001 | 1 185.64 | < 0.001 | ||||
| Q1 | 281.20 ± 69.02 | 2 896 | 105 | 3.50 | ||||
| Q2 | 321.74 ± 75.67 | 2 693 | 309 | 10.29 | ||||
| Q3 | 354.44 ± 78.70 | 2 414 | 586 | 19.53 | ||||
| Q4 | 390.58 ± 85.37 | 1 948 | 1 053 | 35.09 |
Tab.3
Correlation analysis of TyG and TyG-BMI with the disease of HUA"
| 亚组 | 模型1 | 模型2 | 模型3 | |||
|---|---|---|---|---|---|---|
| OR(95%CI) | P值 | OR(95%CI) | P值 | OR(95%CI) | P值 | |
| TyG | ||||||
| Q1 | Ref | Ref | Ref | |||
| Q2 | 2.112(1.750 ~ 2.549) | < 0.001 | 1.788(1.469 ~ 2.176) | < 0.001 | 1.332(1.082 ~ 1.639) | < 0.001 |
| Q3 | 3.848(3.225 ~ 4.592) | < 0.001 | 3.036(2.519 ~ 3.659) | < 0.001 | 1.819(1.473 ~ 2.247) | < 0.001 |
| Q4 | 7.330(6.181 ~ 8.691) | < 0.001 | 5.387(4.490 ~ 6.464) | < 0.001 | 2.579(2.009 ~ 3.31) | < 0.001 |
| TyG-BMI | ||||||
| Q1 | Ref | Ref | Ref | |||
| Q2 | 3.165(2.521 ~ 3.973) | < 0.001 | 2.379(1.879 ~ 3.012) | < 0.001 | 1.692(1.308 ~ 2.189) | < 0.001 |
| Q3 | 5.595(4.402 ~ 7.298) | < 0.001 | 4.347(3.470 ~ 5.445) | < 0.001 | 2.462(1.854 ~ 3.271) | < 0.001 |
| Q4 | 10.895(9.090 ~ 12.351) | < 0.001 | 7.854(6.106 ~ 9.033) | < 0.001 | 3.271(2.646 ~ 5.447) | < 0.001 |
Tab.4
Correlation analysis of TyG and TyG-BMI index of different genders with HUA disease"
| 亚组 | 男性 | 女性 | ||
|---|---|---|---|---|
| 样本量 | OR(95%CI) | 样本量 | OR(95%CI) | |
| TyG | ||||
| Q1 | 1 158(16.44) | Ref | 1 843(37.14) | Ref |
| Q2 | 1 673(23.76) | 1.331(1.068 ~ 1.659) | 1 347(27.15) | 1.06(0.544 ~ 2.065) |
| Q3 | 1 961(27.85) | 1.819(1.456 ~ 2.273) | 1 039(20.91) | 1.346(0.672 ~ 2.696) |
| Q4 | 2 250(31.95) | 2.501(1.942 ~ 3.251) | 733(14.77) | 2.319(1.013 ~ 3.307) |
| TyG-BMI | ||||
| Q1 | 900(12.78) | Ref | 2 101(42.34) | Ref |
| Q2 | 1 628(23.12) | 1.594(1.21 ~ 2.101) | 1 374(27.69) | 1.566(0.746 ~ 2.286) |
| Q3 | 2 117(30.06) | 2.297(1.701 ~ 3.102) | 883(17.80) | 2.411(1.016 ~ 3.718) |
| Q4 | 2 397(34.04) | 3.579(2.45 ~ 5.226) | 603(12.15) | 3.752(1.171 ~ 5.025) |
Tab.5
Analysis of the correlation between TyG and TyG-BMI indices and HUA in young, middle-aged,"
| 亚组 | < 60岁 | ≥ 60岁 | ||
|---|---|---|---|---|
| 样本量 | OR(95% CI) | 样本量 | OR(95% CI) | |
| TyG | ||||
| Q1 | 2 754(27.33) | Ref | 247(12.84) | Ref |
| Q2 | 2 509(24.90) | 0.979(0.779 ~ 1.231) | 493(25.64) | 0.945(0.690 ~ 1.523) |
| Q3 | 2 366(23.48) | 1.118(1.073 ~ 1.405) | 634(32.99) | 1.050(0.734 ~ 2.065) |
| Q4 | 2 448(24.29) | 1.543(1.059 ~ 1.912) | 549(28.55) | 1.482(1.002 ~ 2.366) |
| TyG-BMI | ||||
| Q1 | 2 762(27.41) | Ref | 239(12.43) | Ref |
| Q2 | 2 549(25.30) | 1.513(1.161 ~ 1.966) | 471(24.49) | 1.402(1.064 ~ 2.291) |
| Q3 | 2 406(23.88) | 2.370(1.812 ~ 3.099) | 593(30.84) | 2.017(1.843 ~ 3.818) |
| Q4 | 2 360(23.41) | 4.186(3.158 ~ 5.549) | 620(32.24) | 3.448(2.314 ~ 4.319) |
Tab.6
Predictive value of TyG index and TyG-BMI in HUA"
| 指标 | AUC | 95% CI | P值 |
|---|---|---|---|
| TyG | 0.700 | 0.687 ~ 0.711 | Ref |
| TyG-BMI | 0.747 | 0.732 ~ 0.754 | 0.006 |
| TyG联合TyG-BMI | 0.822 | 0.814 ~ 0.843 | < 0.001 |
| TyG-男 | 0.641 | 0.626 ~ 0.655 | Ref |
| TyG-女 | 0.742 | 0.700 ~ 0.795 | < 0.001 |
| TyG-BMI-男 | 0.674 | 0.657 ~ 0.685 | Ref |
| TyG-BMI-女 | 0.776 | 0.740 ~ 0.812 | < 0.001 |
| TyG联合TyG-BMI-男 | 0.709 | 0.696 ~ 0.722 | Ref |
| TyG联合TyG-BMI-女 | 0.829 | 0.796 ~ 0.862 | < 0.001 |
| TyG(< 60岁) | 0.716 | 0.704 ~ 0.729 | Ref |
| TyG(≥ 60岁) | 0.614 | 0.577 ~ 0.652 | < 0.001 |
| TyG-BMI(< 60岁) | 0.759 | 0.748 ~ 0.770 | Ref |
| TyG-BMI(≥ 60岁) | 0.645 | 0.610 ~ 0.681 | < 0.001 |
| TyG联合TyG-BMI(< 60岁) | 0.835 | 0.826 ~ 0.843 | Ref |
| TyG联合TyG-BMI(≥ 60岁) | 0.731 | 0.699 ~ 0.763 | < 0.001 |
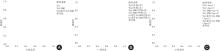
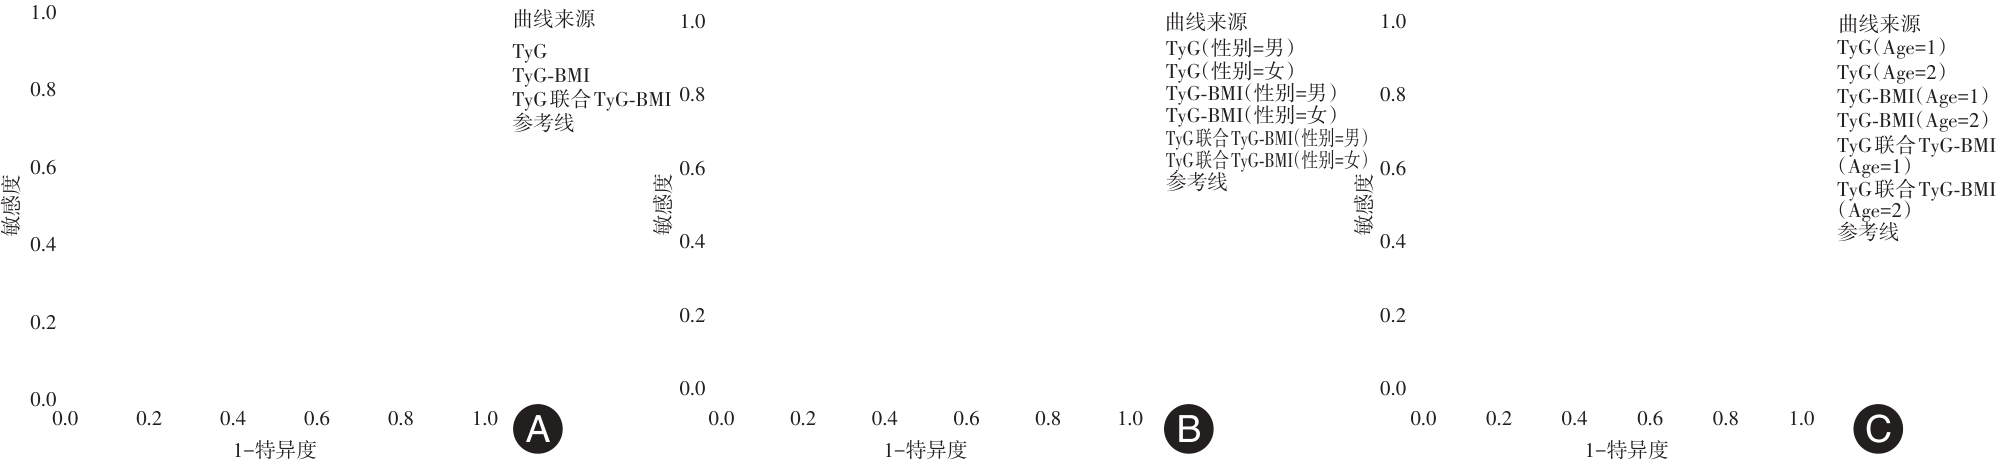
Fig.1
ROC curves of the TyG, TyG-BMI and their combination in predicting the risk of hyperuricemia (HUA)in a physical examination population"
| 1 | 中华医学会内分泌学分会. 中国高尿酸血症与痛风诊疗指南(2019)[J]. 中华内分泌代谢杂志, 2020,36(1):1-13. |
| 2 |
DAWSON J, WYSS A. Chicken or the Egg? Hyperuricemia, Insulin Resistance, and Hypertension[J]. Hypertension, 2017,70(4):698-699. doi:10.1161/hypertensionaha.117.09685
doi: 10.1161/hypertensionaha.117.09685 |
| 3 |
RUDVIK A, MANSSON M. Evaluation of surrogate measures of insulin sensitivity-Correlation with gold standard is not enough[J]. BMC Med Res Methodol, 2018,18(1):64. doi:10.1186/s12874-018-0521-y
doi: 10.1186/s12874-018-0521-y |
| 4 |
SANCHEZ-GARCIA A, RODRIGUEZ-GUTIERREZ R, MANCILLAS-ADAME L, et al. Diagnostic Accuracy of the Triglyceride and Glucose Index for Insulin Resistance: A Systematic Review[J]. Int J Endocrinol, 2020,2020:4678526. doi:10.1155/2020/4678526
doi: 10.1155/2020/4678526 |
| 5 |
LUO Y, LIU L, LIU M, et al. Relationship Between Body Composition and Insulin Resistance Evaluated by the TyG Index: A Retrospective Study Among Chinese Population[J]. Clin Endocrinol (Oxf), 2025, 102(3):264-272. doi:10.1111/cen.15171
doi: 10.1111/cen.15171 |
| 6 | JOG K S, EAGAPPAN S, SANTHARAM R K, et al. Comparison of Novel Biomarkers of Insulin Resistance With Homeostasis Model Assessment of Insulin Resistance, Its Correlation to Metabolic Syndrome in South Indian Population and Proposition of Population Specific Cutoffs for These Indices[J]. Cureus, 2023,15(1):e33653. |
| 7 |
PARK H M, LEE H S, LEE Y J, et al. The triglyceride-glucose index is a more powerful surrogate marker for predicting the prevalence and incidence of type 2 diabetes mellitus than the homeostatic model assessment of insulin resistance[J]. Diabetes Res Clin Pract, 2021,180:109042. doi:10.1016/j.diabres.2021.109042
doi: 10.1016/j.diabres.2021.109042 |
| 8 |
KHAN S H, SOBIA F, NIAZI N K, et al. Metabolic clustering of risk factors: Evaluation of Triglyceride-glucose index (TyG index) for evaluation of insulin resistance[J]. Diabetol Metab Syndr, 2018,10:74. doi:10.1186/s13098-018-0376-8
doi: 10.1186/s13098-018-0376-8 |
| 9 | 宦丽君, 王鹏云. 甘油三酯葡萄糖指数及相关内脏肥胖指标对老年人群高尿酸血症发生风险的预测价值[J]. 检验医学与临床, 2023,20(10):1345-1348, 1353. |
| 10 | 赵美茹, 朱迪, 刘琳, 等. 简易胰岛素抵抗指标与698例2型糖尿病患者发生高尿酸血症风险的关联[J]. 山东大学学报(医学版), 2022,60(12):44-51. |
| 11 |
LIU X Z, XU X, ZHU J Q, et al. Association between three non-insulin-based indexes of insulin resistance and hyperuricemia[J]. Clin Rheumatol, 2019,38(11):3227-3233. doi:10.1007/s10067-019-04671-6
doi: 10.1007/s10067-019-04671-6 |
| 12 | 杨玉环,王军,马茂. 2型糖尿病患者血清尿酸水平与颈动脉粥样硬化斑块及10年心血管疾病风险分析[J]. 中国循证心血管医学杂志,2023,15(12):1322-1324,1333. |
| 13 | NIE Q, ZHANG X, HAO Z, et al. Impact of Serum Uric Acid Concentration on the Risk of Cardiovascular Disease: A Cohort Study Conducted in Northern China[J]. Arq Bras Cardiol, 2021,117(4):666-675. |
| 14 |
OLOFSSON C, ANDERSTAM B, BRAGFORS-HELIN A C, et al. Effects of acute fructose loading on levels of serum uric acid-a pilot study[J]. Eur J Clin Invest, 2019,49(1):e13040. doi:10.1111/eci.13040
doi: 10.1111/eci.13040 |
| 15 | 陈发胜,余俊文,周茹,等. 佛山市三水区中老年人群尿酸水平的相关危险因素分析[J]. 热带医学杂志,2015,15(4):539-541. |
| 16 |
KUANG M, YANG R, HUANG X, et al. Assessing temporal differences in the predictive power of baseline TyG-related parameters for future diabetes: An analysis using time-dependent receiver operating characteristics[J]. J Transl Med, 2023,21(1):299. doi:10.1186/s12967-023-04159-7
doi: 10.1186/s12967-023-04159-7 |
| 17 |
GAO Q, LIN Y, XU R, et al. Positive association of triglyceride-glucose index with new-onset hypertension among adults: A national cohort study in China[J]. Cardiovasc Diabetol, 2023,22(1):58. doi:10.1186/s12933-023-01795-7
doi: 10.1186/s12933-023-01795-7 |
| 18 | 汪宇, 缪莹, 林强, 等. 甘油三酯葡萄糖指数联合腰围对泸州地区中老年人群10年新发冠心病的前瞻性队列研究[J]. 实用医学杂志, 2024,40(12):1731-1736. |
| 19 |
张冰, 孙秋, 杜丽明, 等. 前瞻性队列研究—甘油三酯葡萄糖指数与急性胰腺炎发病风险[J]. 实用医学杂志, 2023,39(23):3116-3119. doi:10.3969/j.issn.1006-5725.2023.23.016
doi: 10.3969/j.issn.1006-5725.2023.23.016 |
| 20 |
ADNAN E, RAHMAN I A, FARIDIN H P. Relationship between insulin resistance, metabolic syndrome components and serum uric acid[J]. Diabetes Metab Syndr, 2019,13(3):2158-2162. doi:10.1016/j.dsx.2019.04.001
doi: 10.1016/j.dsx.2019.04.001 |
| 21 |
ZHANG X, NIE Q, ZHANG Z, et al. Resveratrol affects the expression of uric acid transporter by improving inflammation[J]. Mol Med Rep, 2021,24(2):564. doi:10.3892/mmr.2021.12203
doi: 10.3892/mmr.2021.12203 |
| 22 |
MIAO Z, YAN S, WANG J, et al. Insulin resistance acts as an independent risk factor exacerbating high-purine diet induced renal injury and knee joint gouty lesions[J]. Inflamm Res, 2009,58(10):659-668. doi:10.1007/s00011-009-0031-9
doi: 10.1007/s00011-009-0031-9 |
| 23 |
CUI N, CUI J, SUN J, et al. Triglycerides and Total Cholesterol Concentrations in Association with Hyperuricemia in Chinese Adults in Qingdao, China[J]. Risk Manag Healthc Policy, 2020,13:165-173. doi:10.2147/rmhp.s243381
doi: 10.2147/rmhp.s243381 |
| 24 |
KOJTA I, CHACINSKA M, BLACHNIO-ZABIELSKA A. Obesity, Bioactive Lipids, and Adipose Tissue Inflammation in Insulin Resistance[J]. Nutrients, 2020,12(5):1305. doi:10.3390/nu12051305
doi: 10.3390/nu12051305 |
| 25 | 蒋绒,李永霞. 甘油三酯葡萄糖乘积指数联合肥胖指标对阻塞性睡眠呼吸暂停患者发生非酒精性脂肪性肝病的预测价值[J]. 临床肝胆病杂志,2023,39(3):546-551. |
| 26 |
RAMIREZ-VELEZ R, PEREZ-SOUSA M A, GONZALEZ-RUIZ K, et al. Obesity- and Lipid-Related Parameters in the Identification of Older Adults with a High Risk of Prediabetes According to the American Diabetes Association: An Analysis of the 2015 Health, Well-Being, and Aging Study[J]. Nutrients, 2019,11(11) :2654. doi:10.3390/nu11112654
doi: 10.3390/nu11112654 |
| 27 |
WAN H, ZHANG K, WANG Y, et al. The Associations Between Gonadal Hormones and Serum Uric Acid Levels in Men and Postmenopausal Women With Diabetes[J]. Front Endocrinol (Lausanne), 2020,11:55. doi:10.3389/fendo.2020.00055
doi: 10.3389/fendo.2020.00055 |
| 28 |
WU X, ZHOU M, BU J, et al. Prevalence and Risk Factors of Hyperuricemia in the Urban Health Checkup Population in Xinjiang, China: A Cross-Sectional Study[J]. Risk Manag Healthc Policy. 2023,14;16:1531-1544. doi:10.2147/rmhp.s423794
doi: 10.2147/rmhp.s423794 |
| 29 |
YANG Y, ZHOU W, WANG Y, et al. Gender-specific association between uric acid level and chronic kidney disease in the elderly health checkup population in China[J]. Ren Fail, 2019,41(1):197-203. doi:10.1080/0886022x.2019.1591994
doi: 10.1080/0886022x.2019.1591994 |
| 30 | 冯颖倩,王梦君,张海雄,等. 不同年龄高尿酸血症患者临床特征及其发病影响因素分析[J]. 临床和实验医学杂志,2024,23(2):149-153. |
| 31 |
XIONG J, ZHENG X, LUO J, et al. A follow-up study to explore factors associated with rapid kidney function decline and new-onset kidney disease among Chinese elderly population[J]. Geriatr Gerontol Int, 2022,22(11):968-975. doi:10.1111/ggi.14480
doi: 10.1111/ggi.14480 |
| [1] | Wenjing ZHENG,Xiangling CHU,Yuqiong WU,Min ZHANG,Xiaohong CHU,Nan ZHANG,Honglin HU. Changes in serum NOV/CCN3 levels in mid⁃ to late⁃term pregnant women and their association with gestational diabetes mellitus and pregnancy outcome [J]. The Journal of Practical Medicine, 2025, 41(1): 71-77. |
| [2] | Jianlong SHENG,Ni′na. LIU. The advanced progress on the relationship between hyperuricemia and acute myocardial infarction [J]. The Journal of Practical Medicine, 2024, 40(5): 727-730. |
| [3] | Yuan YANG,Peng HU,Yan. HUANG. Current status of knowledge, attitude and practice of hyperuricemia health management in community medical staff based on mixed methods study [J]. The Journal of Practical Medicine, 2024, 40(14): 2015-2020. |
| [4] | Juan LI,Lin. YANG. Clinical efficacy of Niaoduqing Granule combined with Febusta in treatment of hyperuricemia with renal damage [J]. The Journal of Practical Medicine, 2024, 40(10): 1418-1422. |
| [5] |
WANG Xianfang, LIU Zhidong, ZHANG Yuan, HUANG Changjing, ZHANG Haifei, YU Liqiong, ZHONG Wei..
Association of ABCG2 rs 2231142 and SLC2A9rs 3733591 gene polymorphisms with hyperuricemia in Southern Han population [J]. The Journal of Practical Medicine, 2023, 39(7): 875-880. |
| [6] | Bing ZHANG,Qiu SUN,Liming DU,Shuohua. CHEN. Correlation between triglyceride glucose index and risk of acute pancreatitis: A prospective cohort study [J]. The Journal of Practical Medicine, 2023, 39(23): 3116-3119. |
| [7] |
ZHOU Yingni, SHI Min, LAI Jingbo, LI Xiaomiao, LIU Xiangyang. .
Efficacy of PEX168 combined with metformin in newly diagnosed obese patients with type 2 diabetes melli⁃ tus [J]. The Journal of Practical Medicine, 2023, 39(2): 170-174. |
| [8] |
ZHANG Cuicui, SUN Wenping, XIE Ling..
miR⁃27a attenuates oxidative stress and inflammatory damage in diabetic pregnant rats by targeting TLR4 [J]. The Journal of Practical Medicine, 2023, 39(12): 1487-1493. |
| [9] |
MENG Qizhe, XI Zhi, WANG Ming, WANG Yang, YANG Xiaopeng ..
Correlation between insulin resistance,Tyg index and cerebral microbleeds in patients with cerebral small vessel disease [J]. The Journal of Practical Medicine, 2022, 38(24): 3112-3124. |
| [10] |
PANG Chengzhang, LIU Wenbin, JIN Xiaobao.
“Relocalization”of anti⁃hyperuricemia drugs based on disease gene expression Profile and Drug transcrip⁃ tome [J]. The Journal of Practical Medicine, 2022, 38(22): 2838-2844. |
| [11] |
YUAN Bingkun, LIAO Shengwu, WU Chengkai, PENG Cheng, CHEN Lei, LI Wenyuan..
Study on the relationship between daily sleep duration and the prevalence of hyperuricemia among urban workers in Guangzhou [J]. The Journal of Practical Medicine, 2022, 38(15): 1948-1953. |
| [12] |
WU Chengkai, LIAO Shengwu, FANG Haoting, WANG Yuanyuan, LI Wenyuan. .
Analysis of prevalence and risk factors of hyperuricemia among adults in Guangzhou [J]. The Journal of Practical Medicine, 2021, 37(23): 3072-3076. |
| [13] |
LI Luwei, HUANG Qian, SHI Jiacheng, LIU Xiaoling, WANG Caimei, YU Ping, WU Lan, QIN Yang, JIANG Ren⁃ mei, YU Jian..
Construction and evaluation of hyperuricemia prediction model for overweight and obese population [J]. The Journal of Practical Medicine, 2021, 37(18): 2401-2406. |
| Viewed | ||||||
|
Full text |
|
|||||
|
Abstract |
|
|||||