

The Journal of Practical Medicine ›› 2025, Vol. 41 ›› Issue (13): 2065-2072.doi: 10.3969/j.issn.1006-5725.2025.13.018
• Clinical Research • Previous Articles
Zhengzhang GUI,Lu YE,Yang ZHOU,Ling WANG( ),Yifeng JIN
Received:2025-03-29
Online:2025-07-10
Published:2025-07-18
Contact:
Ling WANG
E-mail:wangling40@126.com
CLC Number:
Zhengzhang GUI,Lu YE,Yang ZHOU,Ling WANG,Yifeng JIN. A comparative study on spirometry and type 2 inflammatory markers in cough⁃variant asthma, asthma⁃COPD overlap, and classic asthma[J]. The Journal of Practical Medicine, 2025, 41(13): 2065-2072.
Tab.1
The comparison of the basic line, spirometry, FeNO, tIgE and blood routine test in CA, CVA and ACO"
| 项目 | 组别 | H/F值 | P值a | ||||
|---|---|---|---|---|---|---|---|
支气管哮喘 (n = 227) | 咳嗽变异性哮喘 (n = 182) | 哮喘-慢性阻塞性 肺病重叠(n = 74) | AC与CVA | CVA与ACO | AC与ACO | ||
| 年龄/岁 | 35.05 ± 12.66 | 41.36 ± 10.17 | 55.00 ± 11.84 | 86.42 | 1.000 | < 0.001 | < 0.001 |
| 身高/cm | 168.00 ± 8.57 | 162.71 ± 9.43 | 164.38 ± 11.07 | 2.36 | 1.000 | 0.270 | 0.093 |
| 体质量/kg | 68.89 ± 15.60 | 62.21 ± 9.72 | 69.00 ± 10.25 | 2.60 | 0.273b | ||
| BMI[M(P25,P75 )]/(kg/m2) | 23.44(20.24,26.08) | 23.50 ± 3.07 | 25.66 ± 4.41 | 1.49 | 0.475b | ||
| 症状时长[M(P25,P75 )]/月 | 9.00(4.00,18.00) | 1.38(0.75,5.25) | 123.38 ± 99.88 | 75.16 | 0.016 | < 0.001 | < 0.001 |
| VT[M(P25,P75)]/L | 1.08(0.89,1.77) | 1.26 ± 0.51 | 1.35 ± 0.69 | 3.24 | 0.198b | ||
| VCmax/L | 4.00 ± 1.02 | 3.63 ± 0.88 | 3.29 ± 1.05 | 11.67 | 0.755 | < 0.001 | < 0.001 |
| ERV/L | 1.31 ± 0.45 | 1.13 ± 0.65 | 1.19 ± 0.62 | 5.31 | 1.000 | 0.006 | 0.011 |
| IC/L | 2.69 ± 0.81 | 2.50 ± 0.57 | 2.10 ± 0.58 | 7.93 | 0.283 | < 0.001 | 0.014 |
| FVC/L | 3.99 ± 1.03 | 3.61 ± 0.89 | 3.24 ± 1.04 | 12.22 | 0.855 | < 0.001 | < 0.001 |
| FEV1/L | 3.03 ± 0.97 | 2.85 ± 0.73 | 1.46 ± 0.60 | 71.68 | 0.001 | < 0.001 | < 0.001 |
| MV[M(P25,P75)]/L | 20.83(13.63,24.69) | 21.72 ± 9.06 | 23.24 ± 12.21 | 1.72 | 0.423b | ||
| FEV1%pred/% | 89.28 ± 16.07 | 97.84 ± 8.82 | 52.49 ± 21.27 | 112.19 | < 0.001 | < 0.001 | < 0.001 |
| FEV1/FVC/% | 75.40 ± 8.44 | 79.04 ± 4.56 | 45.14 ± 14.46 | 175.32 | < 0.001 | < 0.001 | < 0.001 |
| FEV1/VCmax/% | 75.10 ± 8.72 | 78.45 ± 4.39 | 44.20 ± 13.33 | 175.91 | < 0.001 | < 0.001 | < 0.001 |
| PEF/(L/s) | 7.60 ± 2.26 | 7.33 ± 1.69 | 3.83 ± 1.90 | 50.73 | 0.001 | < 0.001 | < 0.001 |
| PEF%pred/% | 97.38 ± 18.44 | 104.35 ± 10.94 | 51.16 ± 22.35 | 99.91 | < 0.001 | < 0.001 | < 0.001 |
| MEF75[M(P25,P75)]/(L/s) | 6.00(4.57,8.39) | 6.25 ± 1.78 | 1.70 ± 0.97 | 122.37 | < 0.001 | < 0.001 | < 0.001 |
| MEF75%pred/% | 87.22 ± 27.71 | 100.27 ± 17.75 | 26.68 ± 17.82 | 149.30 | < 0.001 | < 0.001 | < 0.001 |
| MEF50/(L/s) | 3.20 ± 1.57 | 3.28 ± 0.99 | 0.68 ± 0.32 | 157.26 | < 0.001 | < 0.001 | < 0.001 |
| MEF50%pred/% | 67.78 ± 28.36 | 76.21 ± 15.71 | 16.39 ± 8.68 | 162.02 | < 0.001 | < 0.001 | < 0.001 |
| MEF25[M(P25,P75)]/(L/s) | 0.83(0.61,1.33) | 1.00 ± 0.49 | 0.21 ± 0.11 | 152.03 | < 0.001 | < 0.001 | < 0.001 |
| MEF25%pred/% | 50.47 ± 29.85 | 51.54 ± 16.37 | 14.04 ± 11.54 | 146.76 | < 0.001 | < 0.001 | < 0.001 |
| MMEF/(L/s) | 2.56 ± 1.43 | 2.52 ± 0.91 | 0.52 ± 0.23 | 158.37 | < 0.001 | < 0.001 | < 0.001 |
| MMEF%pred/% | 61.04 ± 27.47 | 66.42 ± 14.90 | 15.76 ± 8.46 | 164.33 | < 0.001 | < 0.001 | < 0.001 |
| FeNO50/ppb | 70.26 ± 50.36 | 52.07 ± 41.09 | 39.50(19.25,83.50) | 2.34 | 0.310b | ||
| FeNO200/ppb | 20.05 ± 13.72 | 17.07 ± 12.19 | 12.00(6.25,24.25) | 0.04 | 0.979b | ||
| CaNO/ppb | 3.16 ± 2.36 | 2.20(0.78,5.00) | 2.64 ± 1.23 | 0.17 | 0.918b | ||
| WBC/(×109/L) | 9.11 ± 2.89 | 6.98 ± 1.54 | 8.69 ± 3.43 | 1.29 | 0.374 | 0.897 | 1.000 |
| EOS[M(P25,P75)]/(×109/L) | 0.20(0.08,0.48) | 0.18(0.09,0.39) | 0.32 ± 0.19 | 9.75 | 0.095 | 0.010 | 0.438 |
| EOS[M(P25,P75)]/% | 3.10(0.60,5.10) | 2.60(1.63,5.18) | 3.87 ± 3.29 | 7.66 | 0.154 | 0.029 | 0.657 |
| BAS[M(P25,P75)]/(×109/L) | 0.04(0.03,0.06) | 0.04 ± 0.02 | 0.03 ± 0.01 | 3.12 | 0.210b | ||
| BAS[M(P25,P75)]/% | 0.50(0.40,0.60) | 0.55 ± 0.28 | 0.35 ± 0.28 | 2.28 | 0.320b | ||
| CRP[M(P25,P75)]/(mg/L) | 1.47(0.65,3.82) | 0.80(0.10,2.29) | 2.20(1.34,12.24) | 3.89 | 0.143b | ||
| tIgE[M(P25,P75)]/(U/L) | 183.53(56.20,387.00) | 69.10(28.48,288.25) | 138.30(58.95,602.00) | 9.45 | 0.018 | 0.038 | 1.000 |
Tab.2
The comparison of sex ratio and small airway function in CA, CVA and ACO"
| 项目 | 支气管哮喘 | 咳嗽变异性哮喘 | 哮喘-慢性阻塞性肺病重叠 | χ2值 | P值 |
|---|---|---|---|---|---|
| 性别 | |||||
| 女 | 132(58.1)a | 118(64.8)a | 27(36.5)b | 17.397 | < 0.001 |
| 男 | 95(41.9)a | 64(35.2)a | 47(63.5)b | ||
| 小气道通气功能障碍 | |||||
| 无 | 73(32.2)a | 103(56.6)c | 0(0)b | 76.139 | < 0.001 |
| 有 | 154(67.8)a | 79(43.4)c | 74(100)b |
Tab.3
The results of logistic regression analysis in CA and CVA"
| 参考类别a | 研究变量 | B | SE | Wald | P值 | OR | 95% CI |
|---|---|---|---|---|---|---|---|
| CVA组 | |||||||
| FEV1%pred | 0.083 | 0.035 | 5.520 | 0.019? | 1.086 | 1.014 ~ 1.164 | |
| FEV1/FVC | 0.142 | 0.063 | 5.185 | 0.023? | 1.153 | 1.020 ~ 1.303 | |
| MEF50%pred | -0.081 | 0.040 | 4.023 | 0.045? | 0.922 | 0.852 ~ 0.998 |
Tab.4
The results of logistic regression analysis in CA and ACO"
| 参考类别a | 研究变量 | B | SE | Wald | P值 | OR | 95% CI |
|---|---|---|---|---|---|---|---|
| ACO组 | |||||||
| FEV1 | -6.241 | 3.113 | 4.018 | 0.045? | 0.002 | 0.000 ~ 0.870 | |
| FEV1%pred | 0.399 | 0.144 | 7.654 | 0.006?? | 1.490 | 1.123 ~ 1.977 | |
| FEV1/FVC | -0.289 | 0.102 | 8.051 | 0.005?? | 0.749 | 0.614 ~ 0.915 |
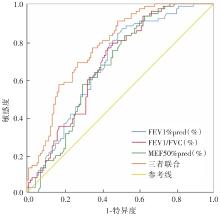
Fig.1
The receiver operating characteristic of FEV1%pred, FEV1/FVC, MEF50% and all the three combined in CA and CVA"
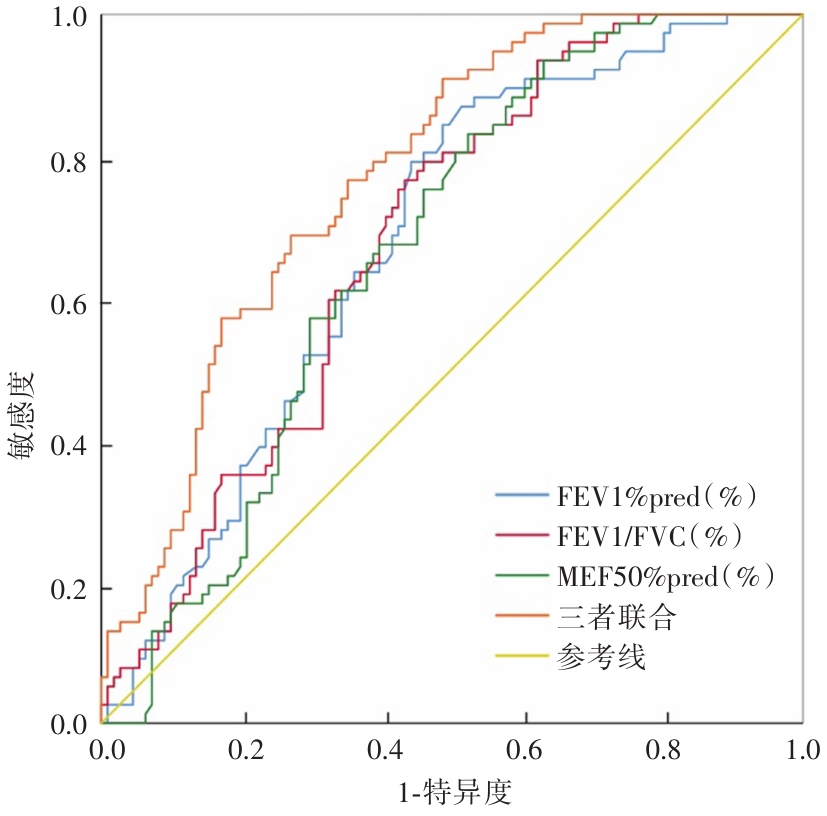
Tab.5
The analystic results of the ROC curve in CA and CVA"
| 项目 | AUC | P值 | 约登指数 | 截断值 | 敏感度 | 特异度 | 阳性预测值 | 阴性预测值 |
|---|---|---|---|---|---|---|---|---|
| FEV1%pred | 0.680 | < 0.001 | 0.358 | 89.200 | / | / | / | / |
| FEV1/FVC | 0.684 | < 0.001 | 0.334 | 76.075 | / | / | / | / |
| MEF50%pred | 0.668 | < 0.001 | 0.309 | 59.800 | / | / | / | / |
| 联合检测 | 0.773 | < 0.001 | 0.423 | / | 0.909 | 0.514 | 0.600 | 0.873 |
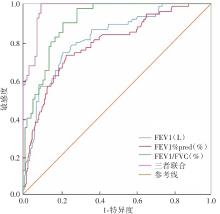
Fig.2
The receiver operating characteristic of FEV1, FEV1%pred, FEV1/FVC, and all the three combined in CA and ACO"
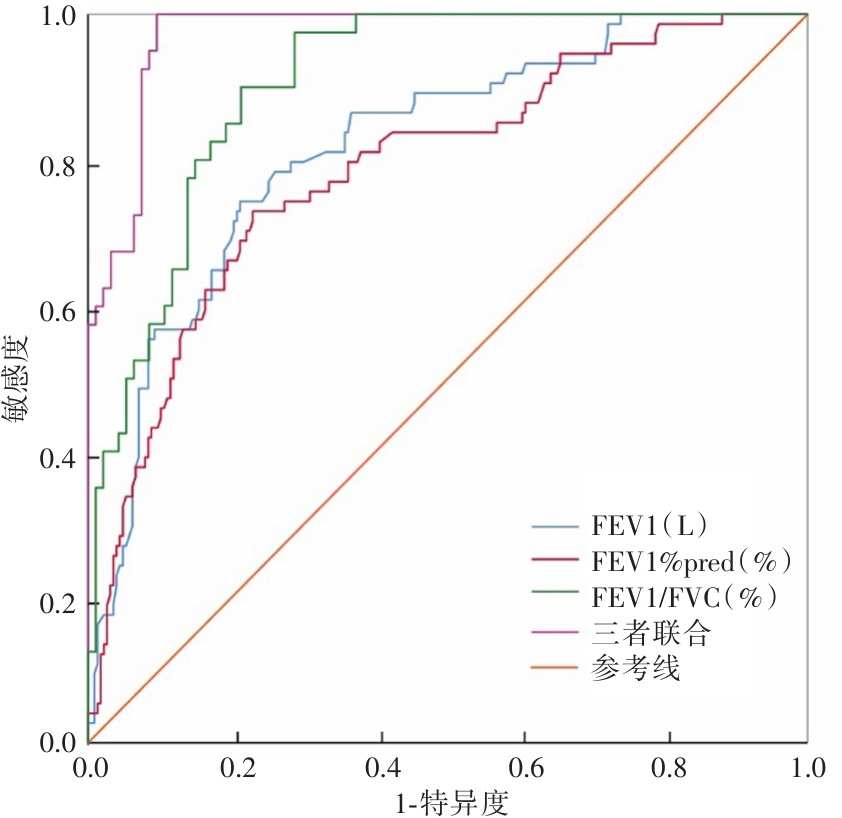
Tab.6
The analystic results of the ROC curve in CA and ACO"
| 项目 | AUC | P值 | 约登指数 | 截断值 | 敏感度 | 特异度 | 阳性预测值 | 阴性预测值 |
|---|---|---|---|---|---|---|---|---|
| FEV1 | 0.819 | < 0.001 | 0.532 | 2.060 | / | / | / | / |
| FEV1%pred | 0.788 | < 0.001 | 0.501 | 75.000 | / | / | / | / |
| FEV1/FVC | 0.891 | < 0.001 | 0.678 | 68.620 | / | / | / | / |
| 联合检测 | 0.973 | < 0.001 | 0.904 | / | 1.000 | 0.904 | 0.771 | 1.000 |
| [1] | Global Initiative for Asthma. Global Strategy for Asthma Management and Prevention, 2023[EB/OL]. (2023-07-06)[2025-03-29]. . |
| [2] |
HAMMAD H, LAMBRECHT B N. The basic immunology of asthma[J]. Cell, 2021,184(6):1469-1485. doi:10.1016/j.cell.2021.02.016
doi: 10.1016/j.cell.2021.02.016 |
| [3] |
中华医学会呼吸病学分会哮喘学组. 支气管哮喘防治指南(2020年版)[J]. 中华结核和呼吸杂志, 2020,43(12):1023-1048. doi:10.3760/cma.j.cn112147-20200618-00721
doi: 10.3760/cma.j.cn112147-20200618-00721 |
| [4] | 中华医学会呼吸病学分会哮喘学组. 咳嗽的诊断与治疗指南(2021)[J]. 中华结核和呼吸杂志, 2022,45(1):13-46. |
| [5] |
NAKAMURA Y, TAMAOKI J, NAGASE H, et al. Japanese guidelines for adult asthma 2020[J]. Allergol Int, 2020,69(4):519-548. doi:10.1016/j.alit.2020.08.001
doi: 10.1016/j.alit.2020.08.001 |
| [6] | 中华医学会呼吸病学分会. 轻度支气管哮喘诊断与治疗中国专家共识(2023) [J]. 中华结核和呼吸杂志, 2023,46(9):880-896. |
| [7] | 张明强,牟向东. 2型炎症型支气管哮喘的生物靶向治疗[J].新医学,2024,55(11):944-949. |
| [8] |
DE DIEGO A, MARTÍNEZ E, PERPIÑÁ M, et al. Airway inflammation and cough sensitivity in cough-variant asthma[J]. Allergy, 2005,60(11):1407-1411. doi:10.1111/j.1398-9995.2005.00609.x
doi: 10.1111/j.1398-9995.2005.00609.x |
| [9] |
LAI K, ZHAN W, WU F, et al. Clinical and Inflammatory Characteristics of the Chinese APCA Cough Variant Asthma Cohort[J]. Front Med (Lausanne), 2022,8:807385. doi:10.3389/fmed.2021.807385
doi: 10.3389/fmed.2021.807385 |
| [10] |
DING B, DIBONAVENTURA M, KARLSSON N, et al. Asthma-chronic obstructive pulmonary disease overlap syndrome in the urban Chinese population: prevalence and disease burden using the 2010, 2012, and 2013 China National Health and Wellness Surveys[J]. Int J Chron Obstruct Pulmon Dis, 2016,11:1139-1150. doi:10.2147/copd.s103873
doi: 10.2147/copd.s103873 |
| [11] |
WHEATON A G, PLEASANTS R A, CROFT J B, et al. Gender and asthma-chronic obstructive pulmonary disease overlap syndrome[J]. J Asthma, 2016,53(7):720-731. doi:10.3109/02770903.2016.1154072
doi: 10.3109/02770903.2016.1154072 |
| [12] |
LEUNG C, SIN D D. Asthma-COPD Overlap: What Are the Important Questions? [J] Chest, 2022,161(2):330-344. doi:10.1016/j.chest.2021.09.036
doi: 10.1016/j.chest.2021.09.036 |
| [13] | Global Initiative for Asthma. Global Strategy for Asthma Management and Prevention, 2024[EB/OL]. Available from: . |
| [14] | 中国呼吸医师协会肺功能与临床呼吸生理工作委员会,中华医学会呼吸病学分会呼吸治疗学组. 肺功能检查报告规范——肺量计检查、支气管舒张试验、支气管激发试验[J]. 中华医学杂志, 2019,99(22):1681-1691. |
| [15] | XIAO D, CHEN Z, WU S, et al. Prevalence and risk factors of small airway dysfunction, and association with smoking, in China: findings from a national cross-sectional study[J]. Lancet Respir Med, 2020,8(11):1081-1093. |
| [16] |
DE LLANO L P, COSÍO B G, IGLESIAS A, et al. Mixed Th2 and non-Th2 inflammatory pattern in the asthma-COPD overlap: a network approach[J]. Int J Chron Obstruct Pulmon Dis, 2018,13:591-601. doi:10.2147/copd.s153694
doi: 10.2147/copd.s153694 |
| [17] | Global Initiative for Chronic Obstructive Lung Disease. Global Strategy for the Diagnosis, Management, and Prevention of Chronic Obstructive Pulmonary Disease (2024 Report)[J]. Am J Respir Crit Care Med, 2025, 187(4):347-365. |
| [18] |
KOH Y Y, JEONG J H, PARK Y, et al. Development of wheezing in patients with cough variant asthma during an increase in airway responsiveness[J]. Eur Respir J, 1999,14(2):302-308. doi:10.1034/j.1399-3003.1999.14b11.x
doi: 10.1034/j.1399-3003.1999.14b11.x |
| [19] |
LIU W, CHEN H, ZHANG D, et al. A retrospective study of clinical features of cough variant asthma in Chinese adults[J]. Allergy Asthma Clin Immunol, 2019,15:3. doi:10.1186/s13223-019-0318-5
doi: 10.1186/s13223-019-0318-5 |
| [20] | 中华医学会呼吸病学分会哮喘学组. 支气管激发试验临床应用中国专家共识(2024版)[J]. 中华医学杂志, 2024,104(22):2031-2040. |
| [21] |
GAO J, WU H, WU F. Small airway dysfunction in patients with cough variant asthma: A retrospective cohort study[J]. BMC Pulm Med, 2021,21(1):49. doi:10.1186/s12890-021-01419-4
doi: 10.1186/s12890-021-01419-4 |
| [22] | 中华医学会变态反应学分会. 2型炎症性疾病机制及靶向治疗专家共识[J]. 中华医学杂志, 2022,102(42):3349-3373. |
| [23] | 缪晔红,沈莹莹,魏源,等. FeNO、外周血EOS计数及血清总IgE对支气管哮喘的联合诊断价值探讨[J]. 国际呼吸杂志, 2022,42(8):583-588. |
| [24] | 张彩霞,王新卫,刘新年,等. 常规肺功能正常的咳嗽变异性哮喘特点[J]. 国际呼吸杂志, 2023,43(8):918-924. |
| [25] |
RAJEEV A, MATHAI S S, KULKARNI B. Use of exhaled nitric oxide in children with bronchial asthma[J]. Med J Armed Forces India, 2015,71(4):337-339. doi:10.1016/j.mjafi.2015.07.001
doi: 10.1016/j.mjafi.2015.07.001 |
| [26] |
DEY S, EAPEN M S, CHIA C, et al. Pathogenesis, clinical features of asthma COPD overlap, and therapeutic modalities[J]. Am J Physiol Lung Cell Mol Physiol, 2022,322(1):L64-L83. doi:10.1152/ajplung.00121.2021
doi: 10.1152/ajplung.00121.2021 |
| [27] |
ALSHABANAT A, ZAFARI Z, ALBANYAN O, et al. Asthma and COPD Overlap Syndrome (ACOS): A Systematic Review and Meta Analysis[J]. PLoS One, 2015,10(9):e0136065. doi:10.1371/journal.pone.0136065
doi: 10.1371/journal.pone.0136065 |
| [28] |
PAPAKONSTANTINOU E, SAVIC S, SIEBENEICHLER A, et al. A pilot study to test the feasibility of histological characterisation of asthma-COPD overlap[J]. Eur Respir J, 2019,53(6):1801941. doi:10.1183/13993003.01941-2018
doi: 10.1183/13993003.01941-2018 |
| [29] |
FOUKA E, PAPAIOANNOU A I, HILLAS G, et al. Asthma-COPD Overlap Syndrome: Recent Insights and Unanswered Questions[J]. J Pers Med, 2022,12(5):708. doi:10.3390/jpm12050708
doi: 10.3390/jpm12050708 |
| [30] | 李然,刘晓芳,王玉红,等. 肺功能在支气管哮喘、COPD及哮喘-COPD重叠中的差异性分析[J]. 国际呼吸杂志, 2021,41(19):1487-1492. |
| [31] |
USMANI O S, HAN M K, KAMINSKY D A, et al. Seven Pillars of Small Airways Disease in Asthma and COPD: Supporting Opportunities for Novel Therapies[J]. Chest, 2021,160(1):114-134. doi:10.1016/j.chest.2021.03.047
doi: 10.1016/j.chest.2021.03.047 |
| Viewed | ||||||
|
Full text |
|
|||||
|
Abstract |
|
|||||