

实用医学杂志 ›› 2025, Vol. 41 ›› Issue (2): 278-287.doi: 10.3969/j.issn.1006-5725.2025.02.019
陈星宇1,肖颖1,林华亮2,Lam Lawrence1( )
)
收稿日期:2024-10-21
出版日期:2025-01-25
发布日期:2025-01-26
通讯作者:
Lam Lawrence
E-mail:tmlam@must.edu.mo
基金资助:
Xingyu CHEN1,Ying XIAO1,Hualiang LIN2,Lawrence Lam.1()
Received:2024-10-21
Online:2025-01-25
Published:2025-01-26
Contact:
Lawrence Lam.
E-mail:tmlam@must.edu.mo
摘要:
目的 探索气态污染物(SO2、NO2、CO、O3)对广东省7个城市心血管疾病入院人数、住院费用和住院时间的影响。 方法 纳入2017年1月至2019年12月广东省7个城市的2 010 905例心血管疾病患者为研究对象。从广东省电子医疗信息系统中获取心血管疾病住院患者人口学特征和住院情况,并在中国高分辨率高质量近地表空气污染物数据集提取SO2、NO2、CO和O3每日暴露浓度。采用多步骤时间序列分析方法估计了气态污染物对广东省7个城市心血管系统疾病的影响。 结果 lag0时(入院当天)SO2、NO2、CO浓度与心血管疾病入院人数、住院费用、住院时长均呈正相关,且NO2影响最大,另外NO2、CO的负面作用存在滞后效应,而O3浓度在lag0-7的时间窗内均与心血管疾病入院人数、住院费用、住院时长呈负相关。 结论 SO2、NO2、CO短期暴露可能与增加心血管疾病患者的疾病负担有一定相关性,且由于NO2较大的负面作用,仍然建议加强NO2的监控。但考虑本研究为回顾性研究,需要进一步开展深入研究。
中图分类号:
陈星宇,肖颖,林华亮,Lam Lawrence. 广东省7个城市气态污染物与心血管疾病入院人数、住院费用和住院天数的关系[J]. 实用医学杂志, 2025, 41(2): 278-287.
Xingyu CHEN,Ying XIAO,Hualiang LIN,Lawrence Lam.. Study on the association between gaseous pollutants and cardiovascular disease hospitalization, hospitalization costs, and hospitalization days in seven cities of Guangdong province[J]. The Journal of Practical Medicine, 2025, 41(2): 278-287.
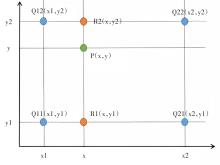
图1
双线性插值原理示意图"
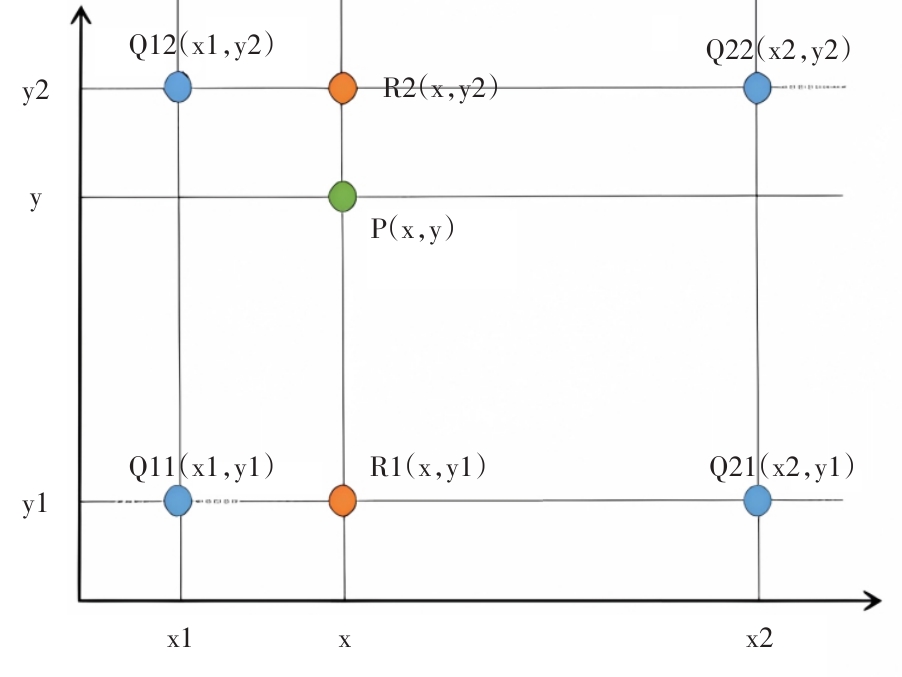
表1
2017—2019年广东7个城市每日CVD入院人数、住院费用和住院天数的描述性统计"
| 地区 | 日入院人数[M(P25,P75)]/例 | 日均住院费用(x ± s)/元 | 日均住院时长(x ± s)/d |
|---|---|---|---|
| 总体 | 203(132, 292) | 4 637 528 ± 4 344 037 | 2 436.00 ± 2 673.94 |
| 东莞市 | 257(298, 225) | 4 734 374 ± 14 534 912 | 2 462.00 ± 645.65 |
| 佛山市 | 196(146, 240) | 2 792 633 ± 1 121 471 | 1 858.16 ± 668.06 |
| 广州市 | 766(389, 873) | 12 853 167 ± 5 409 314 | 8 757.00 ± 3 493.73 |
| 惠州市 | 181(151, 211) | 2 547 067 ± 879 149 | 1 447.28 ± 430.42 |
| 深圳市 | 279(220, 343) | 5 875 943 ± 2 232 953 | 2 940.29 ± 1 059.53 |
| 中山市 | 141(122, 161) | 2 296 549 ± 678 651 | 1 147.42 ± 303.45 |
| 珠海市 | 88(70, 103) | 1 360 887 ± 513 553 | 705.27 ± 215.08 |
表2
不同研究区域入院当天气态污染物概况 (x ± s)"
| 地区 | 污染物及大气相关指标 | |||||
|---|---|---|---|---|---|---|
| SO2/(μg/m3) | NO2/(μg/m3) | CO/(mg/m3) | O3/ppb | 温度/℃ | 相对湿度/% | |
| 总体 | 8.97 ± 3.58 | 37.52 ± 18.19 | 0.80 ± 0.20 | 98.22 ± 46.12 | 22.88 ± 5.22 | 77.71 ± 11.71 |
| 东莞市 | 9.94 ± 2.92 | 37.49 ± 13.04 | 0.83 ± 0.17 | 104.32 ± 46.38 | 22.82 ± 5.21 | 77.02 ± 12.26 |
| 佛山市 | 11.32 ± 4.51 | 45.13 ± 20.44 | 0.86 ± 0.22 | 100.40 ± 53.10 | 22.94 ± 5.45 | 76.11 ± 11.79 |
| 广州市 | 10.29 ± 3.63 | 51.12 ± 20.17 | 0.90 ± 0.21 | 100.06 ± 53.40 | 22.80 ± 5.50 | 76.36 ± 12.14 |
| 惠州市 | 8.74 ± 2.06 | 26.22 ± 7.73 | 0.77 ± 0.15 | 97.39 ± 33.80 | 22.20 ± 5.27 | 78.20 ± 12.47 |
| 深圳市 | 7.31 ± 1.87 | 31.72 ± 12.67 | 0.72 ± 0.16 | 96.13 ± 42.07 | 22.88 ± 4.96 | 78.75 ± 11.41 |
| 中山市 | 8.85 ± 3.36 | 37.03 ± 18.64 | 0.81 ± 0.21 | 98.66 ± 49.69 | 23.18 ± 5.19 | 77.92 ± 10.87 |
| 珠海市 | 6.35 ± 3.28 | 33.92 ± 18.38 | 0.73 ± 0.21 | 90.58 ± 39.83 | 23.33 ± 4.88 | 79.65 ± 10.51 |
表3
入院当天污染物浓度(每上升一个IQR)与住院相关指标的关系(n=2 010 905) (xˉ(95%CI))"
| 污染物 | IQR | 住院费用/元 | 住院时长/d | 入院人数/例 |
|---|---|---|---|---|
| SO2/(μg/m3) | 3.93 | 30 558.70(2 296.45 ~ 58 820.17) | 21.93(8.92 ~ 34.90) | 0.02(0.01 ~ 0.04) |
| NO2/(μg/m3) | 20.68 | 285 600.07(116 245.81 ~ 454 954.33) | 159.07(65.57 ~ 252.36) | 0.08(0.06 ~ 0.08) |
| CO/(mg/m3) | 0.24 | 195 413.45(46 655.96 ~ 344 170.97) | 114.49(29.81 ~ 199.17) | 0.04(0.03 ~ 0.06) |
| O3/ppb | 62.24 | -44 369.83(-83 995.42 ~ -4 743.62) | -25.52(-48.54 ~ -1.87) | -0.02(-0.03 ~ -0.01) |
表4
不同滞后天数污染物浓度(每上升一个IQR)与住院人数、住院花费和住院时长的关系 (xˉ(95%CI))"
| 污染物 | 住院费用/元 | 住院时长/d | 入院人数/例 |
|---|---|---|---|
| SO2/(μg/m3) | |||
| lag0 | 30 558.70(2 296.45 ~ 58 820.17) | 21.93(8.92 ~ 34.90) | 0.024(0.012 ~ 0.035) |
| lag1 | -7 231.70(-35 198.54 ~ 20 735.14) | 3.31(-9.56 ~ 16.64) | 0.004(-0.008 ~ 0.016) |
| lag2 | -16 282.90(-48 286.83 ~ 15 721.07) | 0.51(-14.58 ~ 15.65) | 0.004(-0.004 ~ 0.016) |
| lag3 | -6 687.03(-34 863.79 ~ 21 489.68) | 8.05(-4.93 ~ 21.02) | 0.012(0.001 ~ 0.020) |
| lag4 | -12 062.38(-40 318.95 ~ 16 194.23) | 1.90(-11.17 ~ 14.93) | 0.004(-0.008 ~ 0.016) |
| lag5 | -25 636.38(-53 424.58 ~ 2 151.82) | -5.19(-17.97 ~ 7.59) | 0.002(-0.008 ~ 0.012) |
| lag6 | -29 349.36(-66 965.86 ~ 8 267.18) | -1.07(-16.39 ~ 14.25) | 0.004(-0.004 ~ 0.012) |
| lag7 | -9 179.33(-37 148.54 ~ 18 789.91) | 3.40(-9.52 ~ 16.28) | 0.008(-0.004 ~ 0.016) |
| NO2/(μg/m3) | |||
| lag0 | 285 600.07(116 245.81 ~ 454 954.33) | 159.07(65.57 ~ 252.36) | 0.083(0.062 ~ 0.083) |
| lag1 | 151 761.50(73 317.46 ~ 230 205.75) | 87.35(48.11 ~ 126.37) | 0.062(0.041 ~ 0.062) |
| lag2 | 104 038.72(46 489.42 ~ 161 588.01) | 56.28(32.07 ~ 80.49) | 0.041(0.041 ~ 0.062) |
| lag3 | 42 984.28(15 660.55 ~ 70 308.00) | 27.96(15.33 ~ 40.39) | 0.041(0.021 ~ 0.041) |
| lag4 | 10 425.93(-16 602.16 ~ 37 454.02) | 3.50(-8.84 ~ 16.04) | 0.021(0.004 ~ 0.021) |
| lag5 | -17 451.57(-44 048.54 ~ 9 145.19) | -8.45(-20.39 ~ 3.71) | 0.004(-0.006 ~ 0.012) |
| lag6 | -55 402.00(-107 039.86 ~ -3 764.35) | -9.69(-30.30 ~ 10.72) | 0.002(-0.006 ~ 0.010) |
| lag7 | -32 865.88(-70 458.52 ~ 4 726.98) | -5.95(-20.74 ~ 9.03) | 0.002(-0.002 ~ 0.006) |
| CO/(mg/m3) | |||
| lag0 | 195 413.45(46 655.96 ~ 344 170.97) | 114.49(29.81 ~ 199.17) | 0.044(0.030 ~ 0.058) |
| lag1 | 103 140.70(25 622.38 ~ 180 659.02) | 70.42(24.98 ~ 115.86) | 0.032(0.018 ~ 0.047) |
| lag2 | 100 007.58(36 388.17 ~ 163 626.98) | 60.75(28.46 ~ 93.03) | 0.032(0.021 ~ 0.044) |
| lag3 | 62 149.42(24 572.96 ~ 99 725.87) | 42.14(17.85 ~ 66.43) | 0.025(0.016 ~ 0.033) |
| lag4 | 19 549.30(-6 269.75 ~ 45 368.35) | 9.47(-2.28 ~ 21.22) | 0.009(0.000 ~ 0.018) |
| lag5 | 12 588.68(-13 202.60 ~ 38 379.97) | 5.35(-6.27 ~ 16.98) | 0.006(-0.002 ~ 0.015) |
| lag6 | 36 214.61(10 463.29 ~ 61 965.91) | 17.80(6.13 ~ 29.47) | 0.014(0.005 ~ 0.022) |
| lag7 | 96 602.30(20 196.48 ~ 173 008.11) | 42.06(7.28 ~ 76.84) | 0.019(0.010 ~ 0.028) |
| O3/ppb | |||
| lag0 | -44 369.83(-83 995.42,-4 743.62) | -25.52(-48.54 ~ -1.87) | -0.019(-0.031 ~ -0.006) |
| lag1 | -87 165.14(-140 029.81 ~ -34 300.46) | -39.30(-63.63 ~ -14.35) | -0.031(-0.044 ~ -0.019) |
| lag2 | -58 685.40(-97 777.31 ~ -19 594.11) | -30.45(-50.95 ~ -10.56) | -0.031(-0.037 ~ -0.019) |
| lag3 | -47 380.94(-79 263.33 ~ -15 498.56) | -34.12(-53.35 ~ -14.89) | -0.019(-0.031 ~ -0.012) |
| lag4 | -57 239.95(-97 995.12 ~ -16 484.78) | -32.36(-57.25 ~ -7.47) | -0.019(-0.031 ~ -0.012) |
| lag5 | -67 479.32(-110 942.25 ~ -24 016.39) | -37.91(-63.39 ~ -12.43) | -0.025(-0.031 ~ -0.012) |
| lag6 | -137 894.93(-217 073.00 ~ -58 717.47) | -65.83(-101.85 ~ 29.19) | -0.031(-0.043 ~ -0.025) |
| lag7 | -65 620.39(-116 279.14 ~ -14 961.63) | -31.26(-53.14 ~ 9.38) | -0.019(-0.031 ~ -0.013) |
表5
不同滑动滞后天数污染物浓度(每上升一个IQR)与住院人数、住院花费和住院时长的关系 (xˉ(95%CI))"
| 污染物 | 住院费用/元 | 住院时长/d | 入院人数/例 |
|---|---|---|---|
| SO2/(μg/m3) | |||
| Slag0 | 30 558.70(2 296.45 ~ 58 820.17) | 21.93(8.92 ~ 34.90) | 0.02(0.01 ~ 0.04) |
| Slag01 | 4 663.67(-26 052.12 ~ 35 379.45) | 10.02(-4.17 ~ 24.21) | 0.010(0.00 ~ 0.02) |
| Slag02 | -15 310.91(-47 864.71 ~ 17 242.89) | 0.71(-14.34 ~ 15.76) | 0.005(-0.01 ~ 0.02) |
| Slag03 | -24 564.79(-58 895.70 ~ 9 766.12) | -4.80(-22.85 ~ 13.25) | -0.005(-0.02 ~ 0.01) |
| Slag04 | -34 467.89(-71 506.17 ~ 2 570.38) | -18.14(-46.54 ~ 10.26) | -0.01(-0.03 ~ 0.01) |
| Slag05 | -50 794.01(-94 679.85 ~ -6 908.17) | -28.22(-62.49 ~ 6.06) | -0.01(-0.04 ~ 0.01) |
| Slag06 | -69 336.77(-126 536.58 ~ -12 136.96) | -34.44(-75.05 ~ 6.17) | -0.02(-0.04 ~ 0.01) |
| Slag07 | -76 510.10(-138 882.73 ~ -14 137.47) | -33.62(-74.60 ~ 7.36) | -0.02(-0.04 ~ 0.01) |
| NO2/(μg/m3) | |||
| Slag0 | 285 600.07(116 245.81 ~ 454 954.33) | 159.07(65.57 ~ 252.36) | 0.08(0.06 ~ 0.08) |
| Slag01 | 289 071.57(128 149.22 ~ 449 993.91) | 115.04(70.50 ~ 159.57) | 0.08(0.07 ~ 0.10) |
| Slag02 | 288 746.45(132 747.11 ~ 444 745.80) | 114.54(71.55 ~ 157.52) | 0.09(0.08 ~ 0.10) |
| Slag03 | 261 307.75(121 995.39 ~ 400 620.12) | 104.39(65.39 ~ 143.40) | 0.09(0.08 ~ 0.10) |
| Slag04 | 205 004.05(96 882.04 ~ 313 126.07) | 83.64(52.15 ~ 115.14) | 0.09(0.08 ~ 0.10) |
| Slag05 | 109 710.03(69 034.11 ~ 150 385.94) | 59.86(41.49 ~ 78.23) | 0.08(0.06 ~ 0.09) |
| Slag06 | 91 649.97(48 884.47 ~ 134 415.46) | 55.70(36.34 ~ 75.05) | 0.07(0.06 ~ 0.08) |
| Slag07 | 80 561.63(35 757.80 ~ 125 365.45) | 52.29(31.97 ~ 72.60) | 0.07(0.05 ~ 0.08) |
| CO/(mg/m3) | |||
| Slag0 | 195 413.45(46 655.96 ~ 344 170.97) | 114.49(29.81 ~ 199.17) | 0.04(0.03 ~ 0.06) |
| Slag01 | 175 421.46(76 886.76 ~ 273 956.15) | 78.50(37.70 ~ 119.31) | 0.05(0.03 ~ 0.06) |
| Slag02 | 194 635.55(67 467.72 ~ 321 803.39) | 86.98(43.43 ~ 130.53) | 0.05(0.03 ~ 0.07) |
| Slag03 | 219 403.07(64 601.27 ~ 374 204.88) | 89.87(45.17 ~ 134.57) | 0.05(0.04 ~ 0.07) |
| Slag04 | 155 809.46(70 568.64 ~ 241 050.28) | 84.06(40.71 ~ 127.40) | 0.05(0.03 ~ 0.06) |
| Slag05 | 135 174.87(60 941.56 ~ 209 408.19) | 78.62(37.63 ~ 119.60) | 0.05(0.03 ~ 0.06) |
| Slag06 | 151 785.32(73 206.15 ~ 230 364.50) | 81.34(40.45 ~ 122.23) | 0.05(0.03 ~ 0.06) |
| Slag07 | 163 255.68(78 875.58 ~ 247 635.78) | 91.53(45.70 ~ 137.36) | 0.05(0.04 ~ 0.06) |
| O3/ppb | |||
| Slag0 | -44 369.83(-83 995.42,-4 743.62) | -25.52(-48.54 ~ -1.87) | -0.02(-0.03 ~ -0.01) |
| Slag01 | -94 701.31(-132 070.35 ~ -57 332.27) | -42.24(-60.81 ~ -23.66) | -0.04(-0.05 ~ -0.03) |
| Slag02 | -133 840.18(-188 688.10 ~ -78 992.27) | -60.34(-84.18 ~ -36.51) | -0.05(-0.06 ~ -0.04) |
| Slag03 | -164 671.25(-232 339.50 ~ -97 002.99) | -73.46(-100.80 ~ -46.11) | -0.06(-0.07 ~ -0.05) |
| Slag04 | -200 065.91(-287 386.24 ~ -112 745.58) | -87.53(-120.24 ~ -54.82) | -0.07(-0.08 ~ -0.06) |
| Slag05 | -239 700.3(-352 573.55 ~ -126 827.06) | -102.03(-142.13 ~ -61.93) | -0.07(-0.08 ~ -0.06) |
| Slag06 | -289 964.52(-433 509.27 ~ -146 419.78) | -120.38(-170.59 ~ -70.18) | -0.08(-0.09 ~ -0.07) |
| Slag07 | -326 699.87(-493 917.78 ~ -159 481.97) | -133.83(-192.19 ~ -75.47) | -0.09(-0.10 ~ -0.07) |
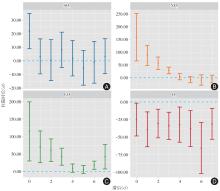
图2
不同滞后天数污染物浓度(每上升一个IQR)与住院时长的关系注:A,SO2浓度在不同滞后天数与住院时长的关系;B,NO2浓度在不同滞后天数与住院时长关系;C,CO浓度在不同滞后天数与住院时长的关系;D,O3浓度在不同滞后天数与住院时长的关系"
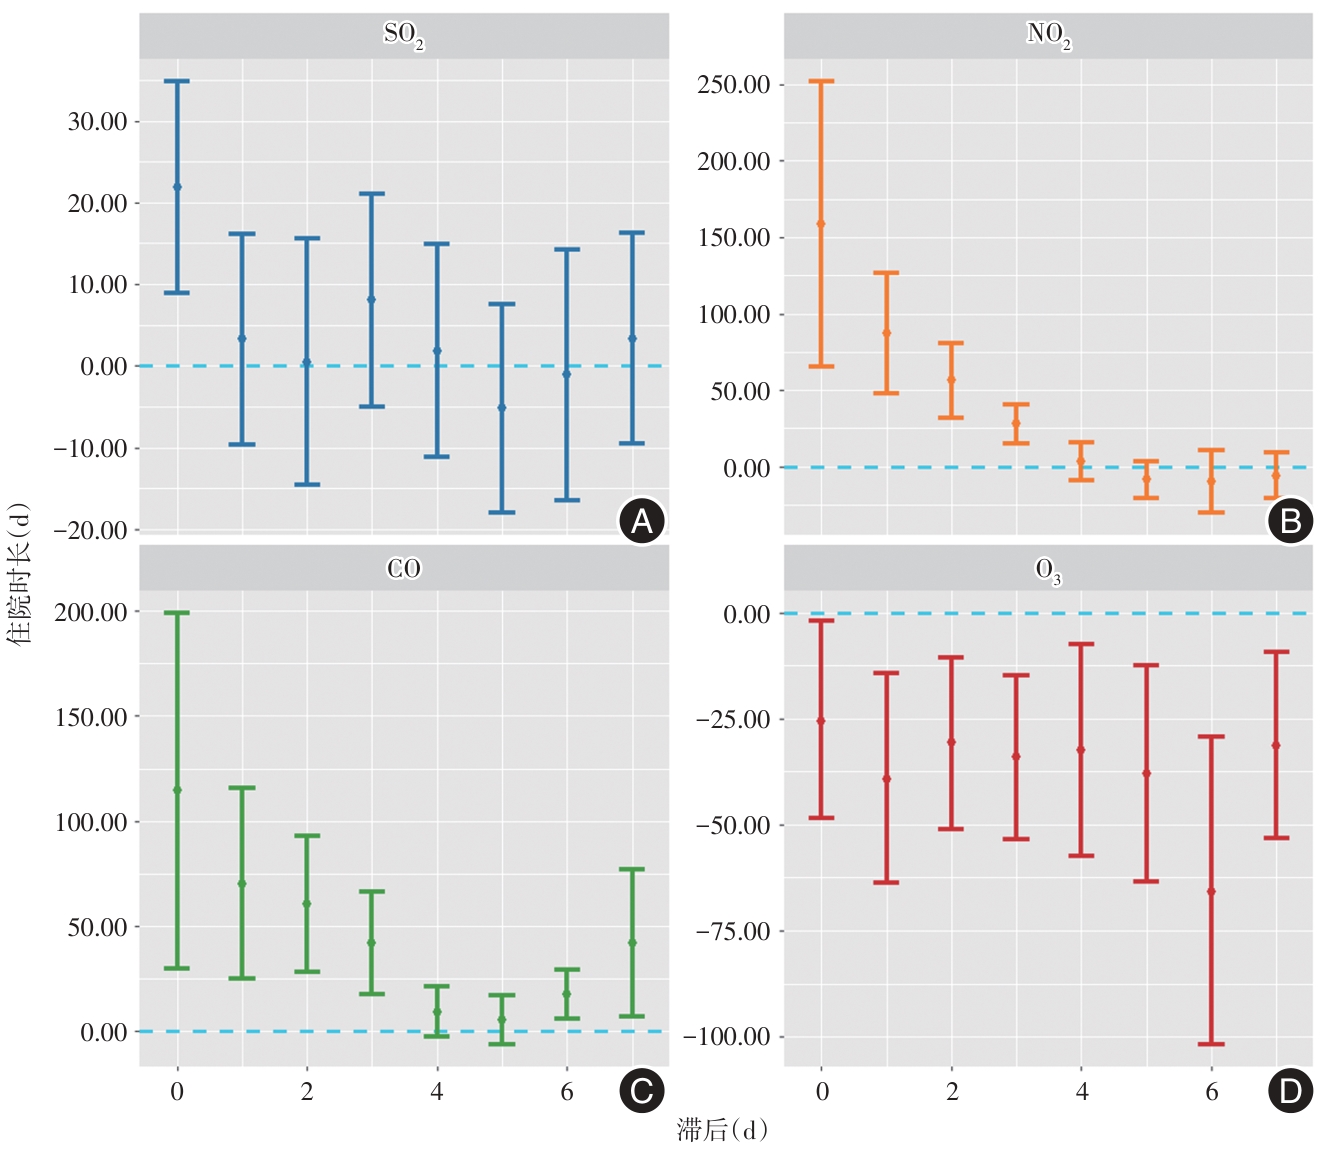
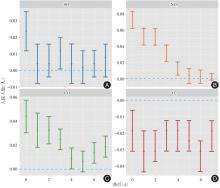
图3
不同滞后天数污染物浓度(每上升一个IQR)与入院人数的关系注:A,SO2浓度在不同滞后天数与住院时长的关系;B,NO2浓度在不同滞后天数与住院时长关系;C,CO浓度在不同滞后天数与住院时长的关系;D,O3浓度在不同滞后天数与住院时长的关系"
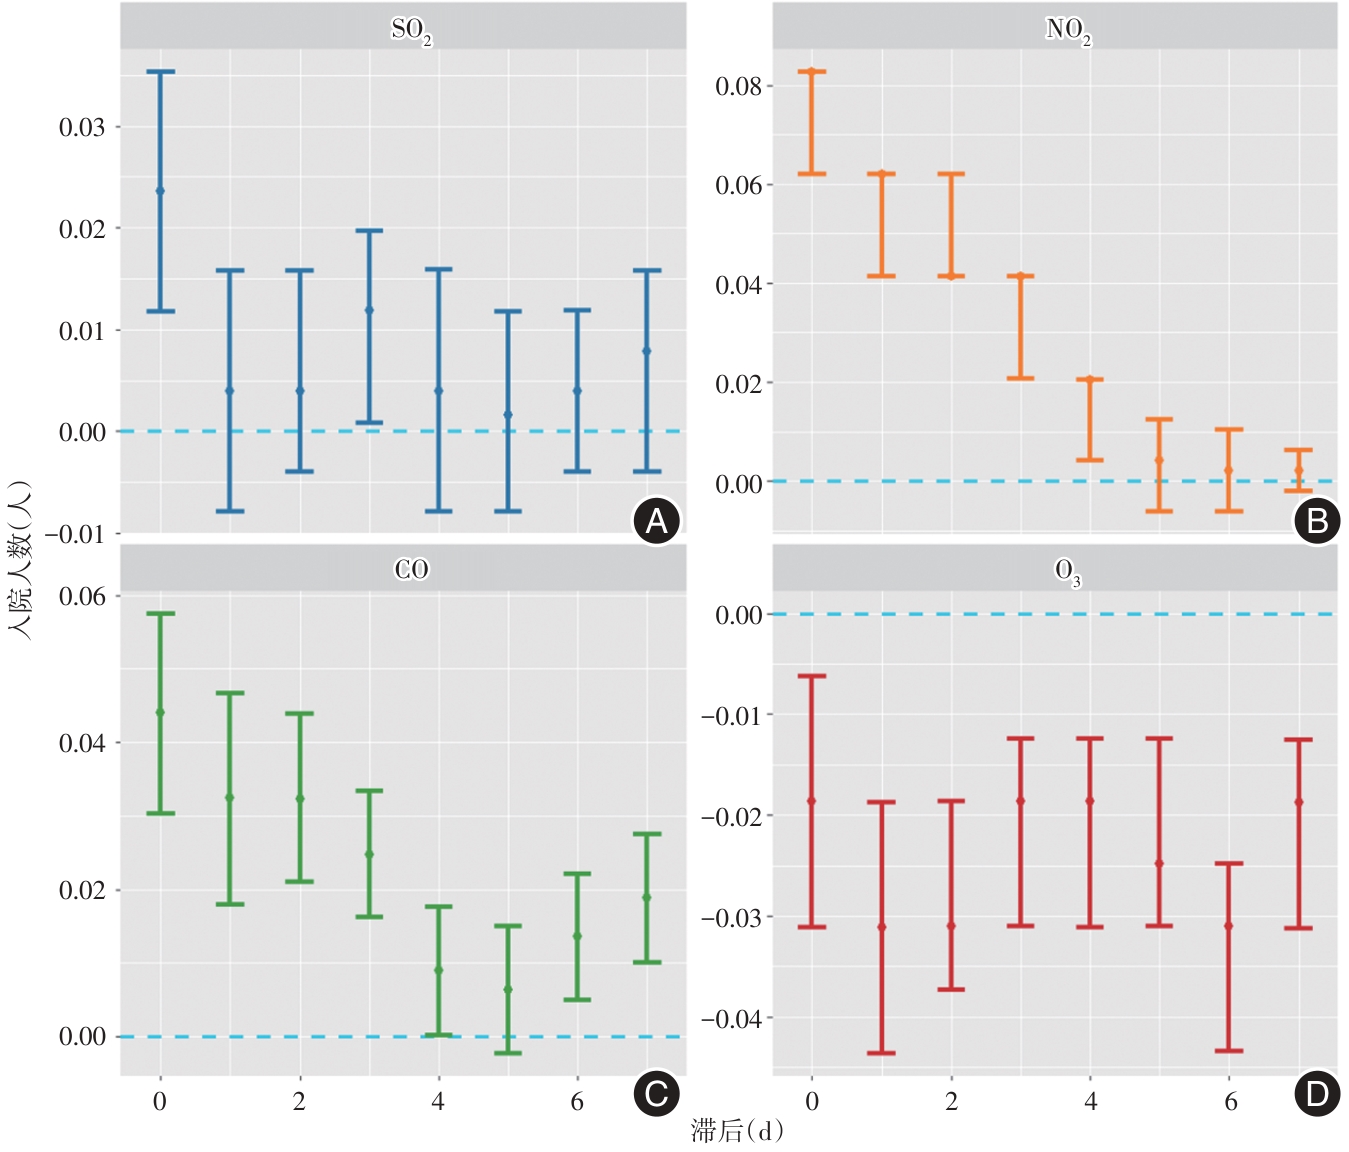
表6
入院当天多污染物浓度对住院相关指标的联合作用"
| 污染物 | 住院费用/元 | 住院时长/d | 入院人数/例 |
|---|---|---|---|
| NO2/(μg/m3) | |||
| +SO2 | 527 621.39(208 847.33, 846 395.44) | 213.21(115.02, 311.39) | 0.14(0.10, 0.18) |
| +CO | 217 643.62(94 225.91, 341 061.34) | 92.66(49.07, 136.24) | 0.08(0.06, 0.09) |
| +O3 | 376 843.55(141 893.50, 611 793.60) | 147.92(86.54, 209.30) | 0.10(0.08, 0.12) |
| SO2/(μg/m3) | |||
| +NO2 | 31 053.07(-59 139.994, 121 246.13) | 14.30(-1.51, 30.11) | 0.02(0.01, 0.03) |
| +CO | -25 337.60(-64 785.64, 14 110.43) | -7.73(-26.88, 11.42) | 0.00(-0.01, 0.01) |
| +O3 | 63 734.96(23 695.79, 103 774.14) | 42.32(20.85, 63.79) | 0.04(0.03, 0.05) |
| CO/(mg/m3) | |||
| +NO2 | 427 942.00(196 255.18, 659 628.90) | 30.76(0.92, 60.60) | 0.10(-0.08, 0.29) |
| +SO2 | 225 073.30(43 033.64, 407 112.97) | 80.33(39.24, 121.42) | 0.73(0.45, 1.00) |
| +O3 | 517 623.10(285 298.32, 749 947.90) | 85.87(45.04, 126.70) | 0.83(0.58, 1.07) |
| O3/ppb | |||
| +NO2 | -207 880.04(-337 896.10, -77 863.97) | -84.86(-124.14, -45.58) | -0.06(-0.07, -0.05) |
| +SO2 | -88 629.05(-132 347.55, -44 910.55) | -48.28(-70.31, -26.25) | -0.04(-0.05, -0.03) |
| +CO | -91 279.05(-136 136.18, -46 421.93) | -49.71(-75.42, -24.00) | -0.03(-0.04, -0.02) |
| 1 | WHO. Invisible numbers: The true extent of noncommunicable diseases and what to do about them[EB/OL](2022-09-15)[2024-10-21]. . |
| 2 |
BROOK R D, RAJAGOPALAN S, POPE C A 3rd, et al. Particulate matter air pollution and cardiovascular disease: An update to the scientific statement from the American Heart Association [J]. Circulation, 2010, 121(21): 2331-2378. doi:10.1161/cir.0b013e3181dbece1
doi: 10.1161/cir.0b013e3181dbece1 |
| 3 | MÜNZEL T, SØRENSEN M, GORI T, et al. Environmental stressors and cardio-metabolic disease: Part II-mechanistic insights[J]. Eur Heart J, 2017, 38(8): 557-564. |
| 4 |
YANG B Y, GUO Y, MARKEVYCH I, et al. Association of Long-term Exposure to Ambient Air Pollutants With Risk Factors for Cardiovascular Disease in China[J]. JAMA Netw Open, 2019, 2(3): e190318. doi:10.1001/jamanetworkopen.2019.0318
doi: 10.1001/jamanetworkopen.2019.0318 |
| 5 |
LI Z, LIU M, WU Z, et al. Association between ambient air pollution and hospital admissions, length of hospital stay and hospital cost for patients with cardiovascular diseases and comorbid diabetes mellitus: Base on 1,969,755 cases in Beijing, China, 2014-2019 [J]. Environ Int, 2022, 165:107301. doi:10.1016/j.envint.2022.107301
doi: 10.1016/j.envint.2022.107301 |
| 6 |
XIE Y, LI Z, ZHONG H, et al. Short-Term Ambient Particulate Air Pollution and Hospitalization Expenditures of Cause-Specific Cardiorespiratory Diseases in China: A Multicity Analysis [J]. Lancet Reg Health West Pac, 2021, 15:100232. doi:10.1016/j.lanwpc.2021.100232
doi: 10.1016/j.lanwpc.2021.100232 |
| 7 |
LIU Y, GUO M, WANG J, et al. Effect of short-term exposure to air pollution on hospital admission for cardiovascular disease: A time-series study in Xiangyang, China [J]. Sci Total Environ, 2024, 918:170735. doi:10.1016/j.scitotenv.2024.170735
doi: 10.1016/j.scitotenv.2024.170735 |
| 8 |
LIU M, YU J, ZHU A, et al. Association Between Air Pollution and Coronary Heart Disease Hospitalizations in Lanzhou City, 2013-2020: A Time Series Analysis [J]. J Urban Health, 2023, 100(6): 1246-1257. doi:10.1007/s11524-023-00797-w
doi: 10.1007/s11524-023-00797-w |
| 9 |
ZHOU Y, JIN Y, ZHANG Z. Short-term exposure to various ambient air pollutants and emergency department visits for cause-stable ischemic heart disease: A time-series study in Shanghai, China [J]. Sci Rep, 2023, 13(1): 16989. doi:10.1038/s41598-023-44321-1
doi: 10.1038/s41598-023-44321-1 |
| 10 |
NOURI F, TAHERI M, ZIADDINI M, et al. Effects of sulfur dioxide and particulate matter pollution on hospital admissions for hypertensive cardiovascular disease: A time series analysis [J]. Front Physiol, 2023, 14:1124967. doi:10.3389/fphys.2023.1124967
doi: 10.3389/fphys.2023.1124967 |
| 11 |
MOTESADDI ZARANDI S, HADEI M, HASHEMI S S, et al. Effects of ambient air pollutants on hospital admissions and deaths for cardiovascular diseases: A time series analysis in Tehran [J]. Environ Sci Pollut Res Int, 2022, 29(12): 17997-18009. doi:10.1007/s11356-021-17051-y
doi: 10.1007/s11356-021-17051-y |
| 12 |
CZERNYCH R, BADYDA A J, KOZERA G, et al. Assessment of Low-Level Air Pollution and Cardiovascular Incidence in Gdansk, Poland: Time-Series Cross-Sectional Analysis [J]. J Clin Med, 2023, 12(6):2206. doi:10.3390/jcm12062206
doi: 10.3390/jcm12062206 |
| 13 |
DONG T F, ZHA Z Q, SUN L, et al. Ambient nitrogen dioxide and cardiovascular diseases in rural regions: A time-series analyses using data from the new rural cooperative medical scheme in Fuyang, East China [J]. Environ Sci Pollut Res Int, 2023, 30(18): 51412-51421. doi:10.1007/s11356-023-25922-9
doi: 10.1007/s11356-023-25922-9 |
| 14 |
SAUCY A, DE HOOGH K, VIENNEAU D, et al. Mutual effects of fine particulate matter, nitrogen dioxide, and fireworks on cause-specific acute cardiovascular mortality: A case-crossover study in communities affected by aircraft noise [J]. Environ Pollut, 2021, 291:118066. doi:10.1016/j.envpol.2021.118066
doi: 10.1016/j.envpol.2021.118066 |
| 15 |
YOU J, LIU Y, DONG J, et al. Ambient carbon monoxide and the risk of cardiovascular disease emergency room visits: A time-series study in Lanzhou, China [J]. Environ Geochem Health, 2023, 45(11): 7621-7636. doi:10.1007/s10653-023-01653-1
doi: 10.1007/s10653-023-01653-1 |
| 16 |
FENG Y T, LANG C F, CHEN C, et al. Association between air pollution exposure and coronary heart disease hospitalization in a humid sub-tropical region of China: A time-series study [J]. Front Public Health, 2022, 10:1090443. doi:10.3389/fpubh.2022.1090443
doi: 10.3389/fpubh.2022.1090443 |
| 17 |
RUS A A, PESCARIU S A, ZUS A S, et al. Impact of Short-Term Exposure to Nitrogen Dioxide (NO(2)) and Ozone (O(3)) on Hospital Admissions for Non-ST-Segment Elevation Acute Coronary Syndrome [J]. Toxics, 2024, 12(2): 123. doi:10.3390/toxics12020123
doi: 10.3390/toxics12020123 |
| 18 |
MENG Y, LIU Z, HAO J, et al. Association between ambient air pollution and daily hospital visits for cardiovascular diseases in Wuhan, China: A time-series analysis based on medical insurance data [J]. Int J Environ Health Res, 2023, 33(5): 452-463. doi:10.1080/09603123.2022.2035323
doi: 10.1080/09603123.2022.2035323 |
| 19 |
FANG Y, CHENG H, LI X, et al. Short-term exposure to ambient air pollution and atrial fibrillation hospitalization: A time-series study in Yancheng, China [J]. Ecotoxicol Environl Saf, 2021, 228:112961. doi:10.1016/j.ecoenv.2021.112961
doi: 10.1016/j.ecoenv.2021.112961 |
| 20 |
BYRNE C P, BENNETT K E, HICKEY A, et al. Short-Term Air Pollution as a Risk for Stroke Admission: A Time-Series Analysis [J]. Cerebrovasc Dis, 2020, 49(4): 404-411. doi:10.1159/000510080
doi: 10.1159/000510080 |
| 21 |
YU J, ZHU A, LIU M, et al. Association Between Air Pollution and Cardiovascular Disease Hospitalizations in Lanzhou City, 2013-2020: A Time Series Analysis [J]. Geohealth, 2024, 8(1): e2022GH000780. doi:10.1029/2022gh000780
doi: 10.1029/2022gh000780 |
| 22 |
CAO X, YOU X, WANG D, et al. Short-term effects of ambient ozone exposure on daily hospitalizations for circulatory diseases in Ganzhou, China: A time-series study [J]. Chemosphere, 2023, 327:138513. doi:10.1016/j.chemosphere.2023.138513
doi: 10.1016/j.chemosphere.2023.138513 |
| 23 |
WEI Y, FEI L, WANG Y, et al. A time-series analysis of short-term ambient ozone exposure and hospitalizations from acute myocardial infarction in Henan, China [J]. Environ Sci Pollut Res Int, 2023, 30(40): 93242-93254. doi:10.1007/s11356-023-28456-2
doi: 10.1007/s11356-023-28456-2 |
| 24 |
ZHU L, FANG J, YAO Y, et al. Long-term ambient ozone exposure and incident cardiovascular diseases: National cohort evidence in China[J]. J Hazar Mater, 2024, 471:134158. doi:10.1016/j.jhazmat.2024.134158
doi: 10.1016/j.jhazmat.2024.134158 |
| 25 |
JIANG Y, HUANG J, LI G, et al. Ozone pollution and hospital admissions for cardiovascular events [J]. Eur Heart J, 2023, 44(18):1622-1632. doi:10.1093/eurheartj/ehad091
doi: 10.1093/eurheartj/ehad091 |
| 26 |
ZHANG Y, MA Y, SHEN J, et al. Effect of ambient O3 on mortality due to circulatory and respiratory diseases in a high latitude city of northeast China [J]. Environ Sci Pollut Res Int, 2022, 29(45): 67776-67786. doi:10.1007/s11356-022-20585-4
doi: 10.1007/s11356-022-20585-4 |
| 27 |
WU H, LU K, FU J. A Time-Series Study for Effects of Ozone on Respiratory Mortality and Cardiovascular Mortality in Nanchang, Jiangxi Province, China [J]. Front Public Health, 2022, 10:864537. doi:10.3389/fpubh.2022.864537
doi: 10.3389/fpubh.2022.864537 |
| 28 |
KHAJAVI A, HASHEMI-MADANI N, HASSANVAND M S, et al. Ambient Air Pollution and Incident Cardiovascular Disease in People with Type 2 Diabetes Mellitus: A cohort study [J]. J Occup Environ Med, 2024, 66(10):e500-e505. doi:10.1097/jom.0000000000003193
doi: 10.1097/jom.0000000000003193 |
| 29 | CHEN Z, LIU N, TANG H, et al. Health effects of exposure to sulfur dioxide, nitrogen dioxide, ozone, and carbon monoxide between 1980 and 2019: A systematic review and meta-analysis [J]. Indoor Air, 2022, 32(11): e13170. |
| 30 |
LIAO M, BRAUNSTEIN Z, RAO X. Sex differences in particulate air pollution-related cardiovascular diseases: A review of human and animal evidence [J].Sci Total Environ, 2023, 884:163803. doi:10.1016/j.scitotenv.2023.163803
doi: 10.1016/j.scitotenv.2023.163803 |
| 31 |
WANG X B, DU J B, CUI H. Sulfur dioxide, a double-faced molecule in mammals [J]. Life Sci, 2014, 98(2): 63-67. doi:10.1016/j.lfs.2013.12.027
doi: 10.1016/j.lfs.2013.12.027 |
| 32 |
DU X, JIANG Y, LI H, et al. Traffic-related air pollution and genome-wide DNA methylation: A randomized, crossover trial [J]. Sci Total Environ, 2022, 850:157968. doi:10.1016/j.scitotenv.2022.157968
doi: 10.1016/j.scitotenv.2022.157968 |
| 33 |
XING M, LIU W, LI X, et al. Vapor isotopic evidence for the worsening of winter air quality by anthropogenic combustion-derived water [J]. Proc Natl Acad Sci U S A, 2020, 117(52): 33005-33010. doi:10.1073/pnas.1922840117
doi: 10.1073/pnas.1922840117 |
| 34 |
BAYRAMOGLU A, KOCAK A O, KADIOGLU E. Ischemic stroke due to carbon monoxide intoxication: Two case reports [J]. World J Emerg Med, 2018, 9(1): 73-75. doi:10.5847/wjem.j.1920-8642.2018.01.013
doi: 10.5847/wjem.j.1920-8642.2018.01.013 |
| 35 |
HASHEMZAEI M, BARANI A K, IRANSHAHI M, et al. Effects of resveratrol on carbon monoxide-induced cardiotoxicity in rats [J]. Environ Toxicol Pharmacol, 2016, 46:110-115. doi:10.1016/j.etap.2016.07.010
doi: 10.1016/j.etap.2016.07.010 |
| 36 |
PANDOLFI S, CHIRUMBOLO S, FRANZINI M, et al. Oxygen-ozone therapy for myocardial ischemic stroke and cardiovascular disorders [J]. Med Gas Res, 2024, 15(1):36-43. doi:10.4103/mgr.medgasres-d-23-00013
doi: 10.4103/mgr.medgasres-d-23-00013 |
| 37 |
ZHANG D, CHEN W, CHENG C, et al. Air pollution exposure and heart failure: A systematic review and meta-analysis [J]. Sci Total Environ, 2023, 872:162191. doi:10.1016/j.scitotenv.2023.162191
doi: 10.1016/j.scitotenv.2023.162191 |
| 38 |
ZONG Z, ZHANG M, XU K, et al. Association between Short-Term Exposure to Ozone and Heart Rate Variability: A Systematic Review and Meta-Analysis [J]. Int J Environ Res Public Health, 2022, 19(18): 11186. doi:10.3390/ijerph191811186
doi: 10.3390/ijerph191811186 |
| 39 |
TIAN L, CHU N, YANG H, et al. Acute ozone exposure can cause cardiotoxicity: Mitochondria play an important role in mediating myocardial apoptosis [J]. Chemosphere, 2021, 268:128838. doi:10.1016/j.chemosphere.2020.128838
doi: 10.1016/j.chemosphere.2020.128838 |
| [1] | 陈幸,邓燕. 巨噬细胞的谷氨酰胺代谢重编程在心血管疾病中的作用[J]. 实用医学杂志, 2024, 40(22): 3262-3267. |
| [2] | 马丽娜,曹振华,杨冰. 小而密低密度脂蛋白胆固醇、CXC型趋化因子配体12与糖尿病患者并发心血管疾病的相关性[J]. 实用医学杂志, 2023, 39(22): 2953-2957. |
| [3] | 王小霞,黄巧,彭闵,申铁梅. 心血管疾病老年共病患者出院准备服务的应用效果[J]. 实用医学杂志, 2023, 39(22): 3005-3009. |
| [4] | 韩鹏 张云雷 杨淑霞 孙晓晨 王文军 . 2016-2021年淄博市宫颈癌发病、死亡及疾病负担趋势分析 [J]. 实用医学杂志, 2023, 39(10): 1290-1295. |
| [5] | 李柔 凌飞翔 马礼兵, . 疫苗在呼吸道感染性疾病的应用及研究现状 [J]. 实用医学杂志, 2023, 39(1): 6-11. |
| [6] | 李林峭 马礼兵, . 慢性呼吸疾病与新型冠状病毒肺炎共患风险的研究现状及进展 [J]. 实用医学杂志, 2022, 38(23): 2893-2897. |
| [7] | 刘馨蜜 刘景 吴珊珊. 空气污染对辅助生殖技术影响的相关研究进展及挑战[J]. 实用医学杂志, 2022, 38(21): 2639-2642. |
| [8] | 黎柳, 喻剑华. 艾滋病相关心血管疾病的风险因素与防治进展 [J]. 实用医学杂志, 2021, 37(20): 2687-2691. |
| 阅读次数 | ||||||
|
全文 |
|
|||||
|
摘要 |
|
|||||