

实用医学杂志 ›› 2025, Vol. 41 ›› Issue (12): 1913-1921.doi: 10.3969/j.issn.1006-5725.2025.12.021
• 调查研究 • 上一篇
舒杨1,2,陈浩3,Lam Lawrence1( )
)
收稿日期:2025-04-09
出版日期:2025-06-25
发布日期:2025-07-02
通讯作者:
Lam Lawrence
E-mail:talam@must.edu.mo
基金资助:
Yang SHU1,2,Hao CHEN3,Lawrence Lam1()
Received:2025-04-09
Online:2025-06-25
Published:2025-07-02
Contact:
Lawrence Lam
E-mail:talam@must.edu.mo
摘要:
目的 本研究旨在评估环境污染与死亡率之间的关系以及社会经济地位(SES)的中介作用。 方法 本研究使用了318 974名英国生物样本库参与者的数据。SES采用汤森剥夺指数(TDI)评估。运用Cox回归模型检验环境污染与全因死亡率、特定原因死亡率的关系,通过线性回归分析TDI与污染在死亡风险中的中介作用。 结果 随访期间共发生24 909例死亡,平均年龄61.5岁。除PM10外,其他污染物均与全因死亡率相关,PM2.5与特定原因死亡率相关。环境污染评分越高,全因死亡率HR越高,最高五分位数组HR为1.13(95% CI:1.09 ~ 1.18)。社会经济剥夺越严重,全因死亡率HR越高,最贫困组HR为1.36(95% CI:1.24 ~ 1.49)。 结论 环境污染是死亡的风险因素,社会经济起一定的中介作用。除了实施公共卫生干预和个人行为指导外,还需通过社会政策创新和财政支持机制,改善贫困地区的整体环境状况。
中图分类号:
舒杨,陈浩,Lam Lawrence. 社会经济地位在环境污染与死亡率关系中的作用[J]. 实用医学杂志, 2025, 41(12): 1913-1921.
Yang SHU,Hao CHEN,Lawrence Lam. The role of socioeconomic status in the relationship between environmental pollution and mortality[J]. The Journal of Practical Medicine, 2025, 41(12): 1913-1921.

图1
描述队列的流程图"
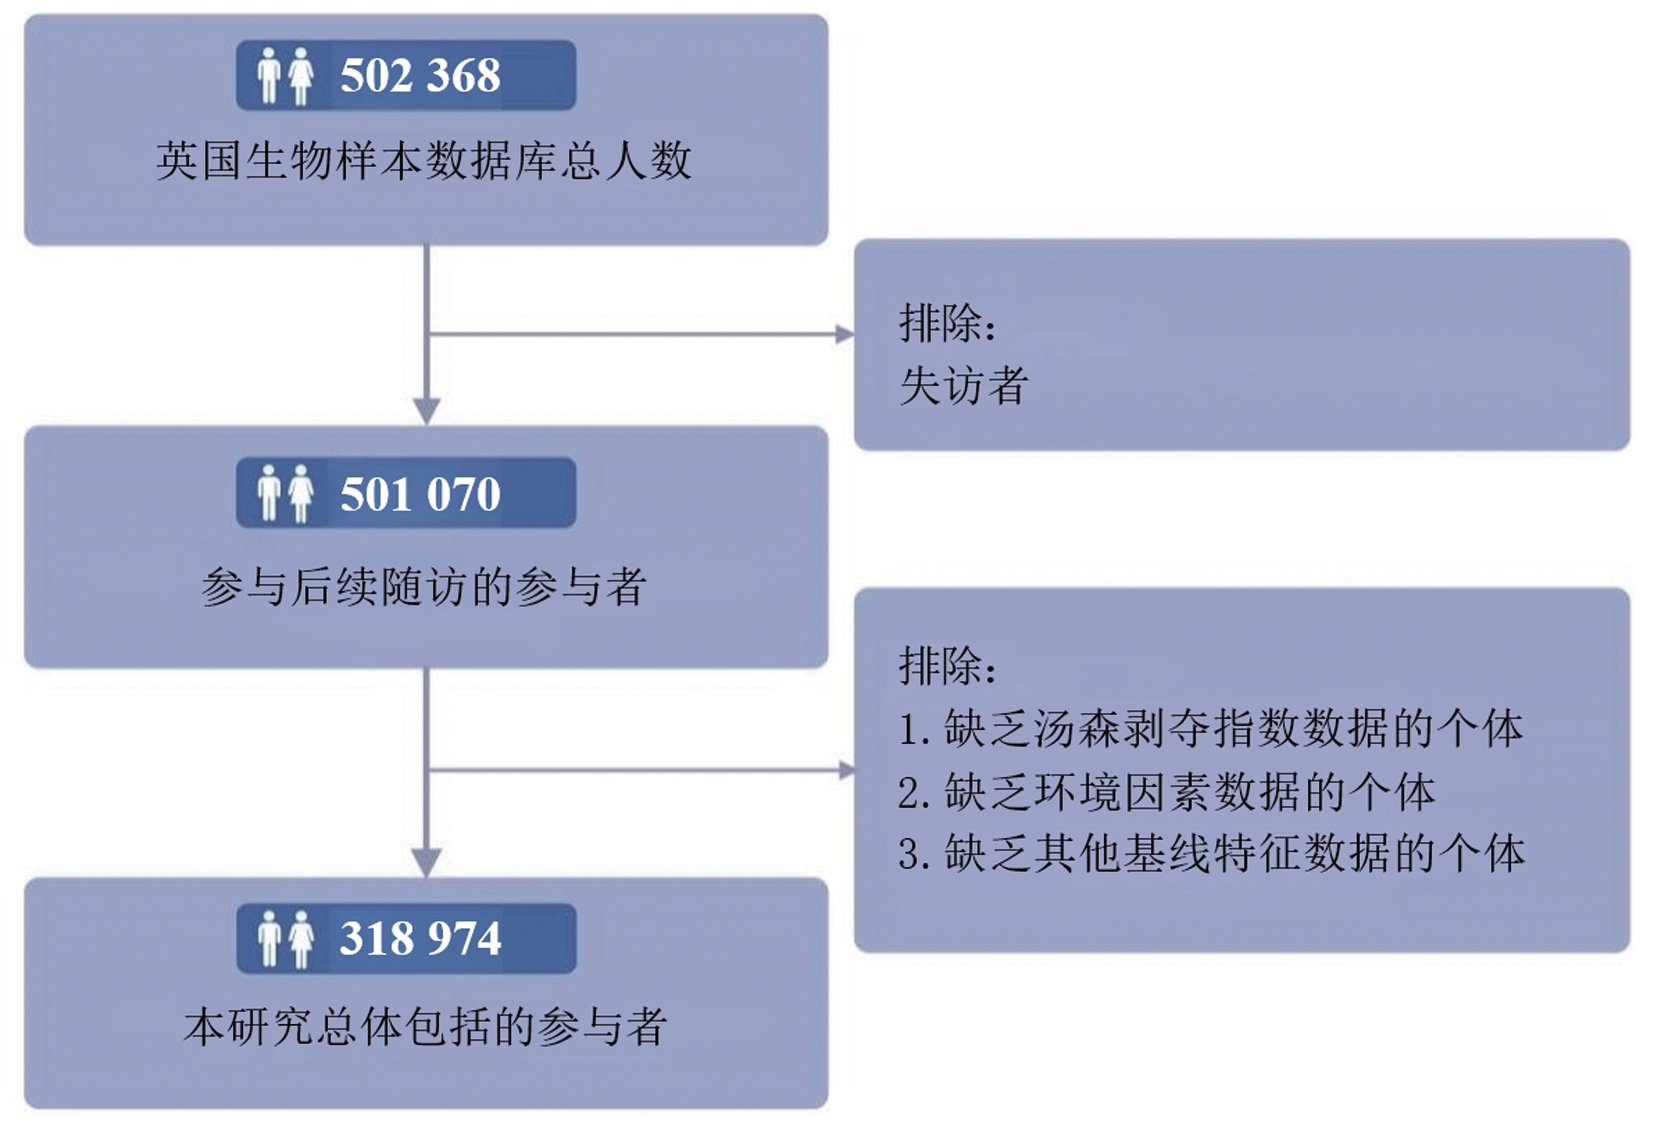
图2
环境因素与不同死因的有向无环图"
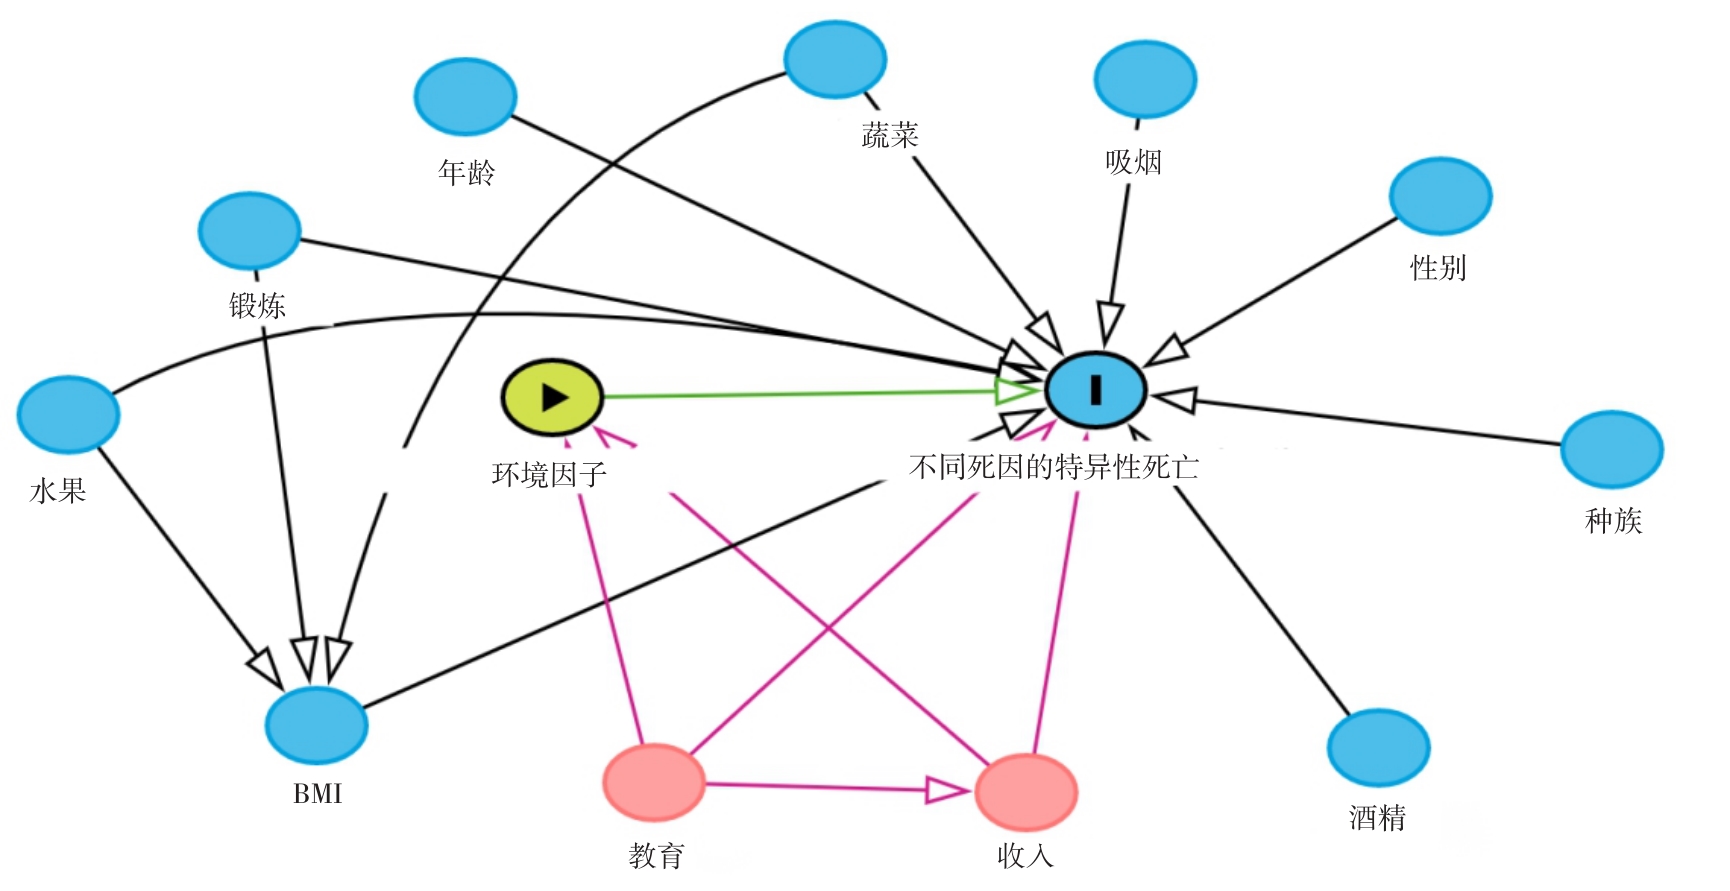
表1
参与者的基线特征(基于EPS) (x ± s)"
| 项目 | EPS | ||||
|---|---|---|---|---|---|
| 第1五分位组 | 第2五分位组 | 第3五分位组 | 第4五分位组 | 第5五分位组 | |
| 例数 | 65 274 | 63 974 | 63 245 | 63 241 | 63 240 |
| 年龄/岁 | 56.7 ± 7.9 | 56.5 ± 8.0 | 56.2 ± 8.1 | 55.6 ± 8.2 | 55.0 ± 8.2 |
| 性别/[例(%)] | |||||
| 女 | 32 823(50.3) | 32 384(50.6) | 32 276(51.0) | 32 533(51.4) | 32 638(51.6) |
| 男 | 32 451(49.7) | 31 590(49.4) | 30 969(49.0) | 30 708(48.6) | 30 602(48.4) |
| 种族/[例(%)] | |||||
| 非白人 | 883(1.4) | 1 710(2.7) | 2 513(4.0) | 4 130(6.5) | 5 907(9.3) |
| 白人 | 64 391(98.6) | 62 264(97.3) | 60 732(96.0) | 59 111(93.5) | 57 333(90.7) |
| BMI | |||||
| < 18.5 kg/m2 | 253 ± 0.4 | 268 ± 0.4 | 289 ± 0.5 | 325 ± 0.5 | 424 ± 0.7 |
| 18.5 ~ 24.9 kg/m2 | 22 660 ± 34.7 | 20 937 ± 32.7 | 20 351 ± 32.2 | 20 463 ± 32.4 | 21 414 ± 33.9 |
| 25.0 ~ 29.9 kg/m2 | 28 968 ± 44.4 | 28 164 ± 44.0 | 27 160 ± 42.9 | 26 729 ± 42.3 | 26 152 ± 41.4 |
| ≥ 30.0 kg/m2 | 13 393 ± 20.5 | 14 605 ± 22.8 | 15 445 ± 24.4 | 15 724 ± 24.9 | 15 250 ± 24.1 |
| 收入/[例(%)] | |||||
| < 18 000英镑 | 9 333(14.3) | 12 143(19.0) | 13 814(21.8) | 15 105(23.9) | 16 681(26.4) |
| 18 000 ~ 30 999英镑 | 15 407(23.6) | 16 570(25.9) | 16 538(26.1) | 16 182(25.6) | 15 128(23.9) |
| 31 000 ~ 51 999英镑 | 18 176(27.8) | 17 803(27.8) | 17 087(27.0) | 16 597(26.2) | 15 108(23.9) |
| 52 000 ~ 100 000英镑 | 16 997(26.0) | 14 157(22.1) | 12 995(20.5) | 12 458(19.7) | 11 966(18.9) |
| > 100 000英镑 | 5 361(8.2) | 3 301(5.2) | 2 811(4.4) | 2 899(4.6) | 4 357(6.9) |
| 教育/[例(%)] | |||||
| 大学学历 | 25 582(39.2) | 21 816(34.1) | 20 808(32.9) | 21 882(34.6) | 26 245(41.5) |
| 其他 | 39 692(60.8) | 42 158(65.9) | 42 437(67.1) | 41 359(65.4) | 36 995(58.5) |
| 吸烟/[例(%)] | |||||
| 从不 | 37 642(57.7) | 36 090(56.4) | 34 671(54.8) | 34 171(54.0) | 31 421(49.7) |
| 从前会 | 22 874(35.0) | 22 525(35.2) | 22 410(35.4) | 22 068(34.9) | 22 951(36.3) |
| 现在会 | 4 758(7.3) | 5 359(8.4) | 6 164(9.7) | 7 002(11.1) | 8 868(14.0) |
| 饮酒/[例(%)] | |||||
| 从不 | 3 202(4.9) | 3 888(6.1) | 4 398(7.0) | 4 843(7.7) | 5 596(8.8) |
| 仅限特殊场合 | 5 271(8.1) | 6 213(9.7) | 6 887(10.9) | 7 154(11.3) | 7 274(11.5) |
| 每月饮酒量> 1杯 | 56 801(87.0) | 53 873(84.2) | 51 960(82.2) | 51 244(81.0) | 50 370(79.6) |
| PM2.5 | 8.7 ± 0.4 | 9.5 ± 0.3 | 9.9 ± 0.3 | 10.4 ± 0.4 | 11.5 ± 0.9 |
| PM10 | 14.4 ± 1.7 | 15.8 ± 1.4 | 16.4 ± 1.4 | 16.8 ± 1.5 | 17.7 ± 1.8 |
| NO2 | 17.1 ± 2.7 | 22.6 ± 2.4 | 26.2 ± 2.5 | 29.8 ± 2.7 | 37.0 ± 6.2 |
| NOx | 26.7 ± 4.4 | 36.2 ± 3.8 | 42.1 ± 3.7 | 48.4 ± 4.2 | 65.8 ± 16.8 |
| 噪音 | 55.2 ± 3.0 | 54.9 ± 2.8 | 55.2 ± 3.0 | 56.1 ± 3.4 | 59.8 ± 6.1 |
| TDI/[例(%)] | |||||
| 第1五分位组 | 21 742(33.3) | 19 118(29.9) | 14 077(22.3) | 7 752(12.3) | 3 511(5.6) |
| 第2五分位组 | 19 593(30.0) | 16 353(25.6) | 14 080(22.3) | 10 963(17.3) | 5 382(8.5) |
| 第3五分位组 | 13 401(20.5) | 13 270(20.7) | 14 213(22.5) | 14 512(22.9) | 9 030(14.3) |
| 第4五分位组 | 7 712(11.8) | 9 670(15.1) | 12 650(20.0) | 16 842(26.6) | 17 539(27.7) |
| 第5五分位组 | 2 826(4.3) | 5 563(8.7) | 8 225(13.0) | 13 172(20.8) | 27 778(43.9) |
表2
EPS/TDI与疾病死亡率之间的关联"
| 项目 | EPS | TDI | ||
|---|---|---|---|---|
| HR(95%CI) | P值 | HR(95%CI) | P值 | |
| 全因死亡率 | ||||
| 第1五分位组 | 1(Ref) | < 0.001 | 1(Ref) | < 0.001 |
| 第2五分位组 | 1.00(0.96 ~ 1.04) | 1.03(0.99~1.07) | ||
| 第3五分位组 | 1.04(1.00 ~ 1.08) | 1.04(1.00 ~ 1.08) | ||
| 第4五分位组 | 1.08(1.03 ~ 1.12) | 1.12(1.07 ~ 1.16) | ||
| 第5五分位组 | 1.13(1.09 ~ 1.18) | 1.29(1.24 ~ 1.35) | ||
| 癌症特异性死亡率 | ||||
| 第1五分位组 | 1(Ref) | < 0.001 | 1(Ref) | < 0.001 |
| 第2五分位组 | 1.01(0.96 ~ 1.07) | 1.04(0.98 ~ 1.10) | ||
| 第3五分位组 | 1.03(0.97 ~ 1.09) | 1.03(0.98 ~ 1.09) | ||
| 第4五分位组 | 1.08(1.02 ~ 1.14) | 1.05(0.99 ~ 1.11) | ||
| 第5五分位组 | 1.12(1.06 ~ 1.18) | 1.16(1.09 ~ 1.23) | ||
| 心血管疾病特异性死亡率 | ||||
| 第1五分位组 | 1(Ref) | 0.06 | 1(Ref) | < 0.001 |
| 第2五分位组 | 0.99(0.90 ~ 1.08) | 1.06(0.97 ~ 1.17) | ||
| 第3五分位组 | 1.03(0.95 ~ 1.13) | 1.08(0.98 ~ 1.18) | ||
| 第4五分位组 | 1.04(0.95 ~ 1.13) | 1.23(1.12 ~ 1.35) | ||
| 第5五分位组 | 1.08(0.98 ~ 1.18) | 1.36(1.24 ~ 1.49) | ||
| 呼吸疾病特异性死亡率 | ||||
| 第1五分位组 | 1(Ref) | < 0.05 | 1(Ref) | < 0.001 |
| 第2五分位组 | 0.93(0.76 ~ 1.14) | 0.86(0.69 ~ 1.07) | ||
| 第3五分位组 | 1.04(0.85 ~ 1.26) | 0.99(0.80 ~ 1.22) | ||
| 第4五分位组 | 1.16(0.96 ~ 1.41) | 1.28(1.05 ~ 1.57) | ||
| 第5五分位组 | 1.24(1.03 ~ 1.50) | 1.70(1.40 ~ 2.06) | ||
图3
EPS组和TDI组的交叉分布及全因死亡率风险比"
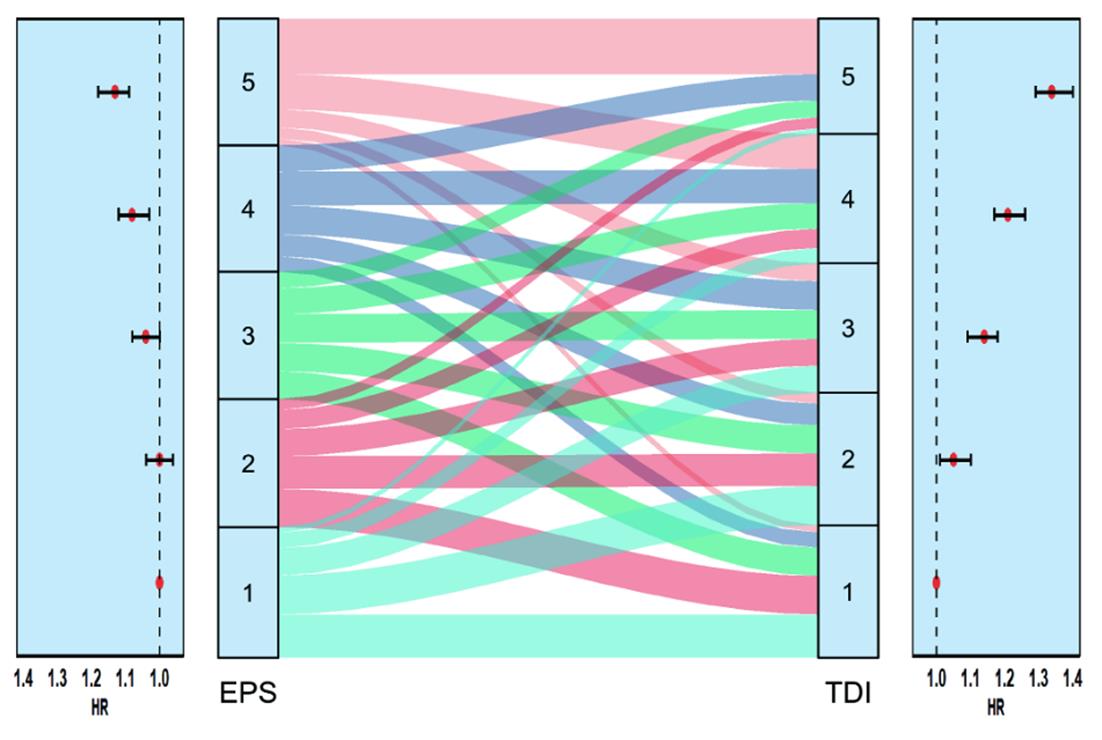
表3
暴露于空气污染/噪音与疾病死亡率之间的关联"
| 项目 | PM2.5 | PM10 | NO2 | NOx | 噪音 |
|---|---|---|---|---|---|
| HR(95%CI) | HR(95%CI) | HR(95%CI) | HR(95%CI) | HR(95%CI) | |
| 全因死亡率 | 1.04(1.03 ~ 1.05) | 1.00(0.99 ~ 1.01) | 1.01(1.00 ~ 1.01) | 1.05(1.01 ~ 1.08) | 1.00(1.00 ~ 1.01) |
| 癌症特异性死亡率 | 1.03(1.01 ~ 1.05) | 1.01(0.99 ~ 1.02) | 1.00(1.00 ~ 1.01) | 1.00(1.00 ~ 1.00) | 1.00(0.99 ~ 1.01) |
| 心血管疾病特异性死亡率 | 1.03(1.00 ~ 1.06) | 1.00(0.98 ~ 1.01) | 1.00(0.99 ~ 1.01) | 1.00(1.00 ~ 1.00) | 1.01(1.00 ~ 1.01) |
| 呼吸疾病特异性死亡率 | 1.11(1.05 ~ 1.17) | 1.02(0.99 ~ 1.05) | 1.01(1.01 ~ 1.02) | 1.01(1.00 ~ 1.01) | 1.01(0.99 ~ 1.02) |
表4
协变量多重插补后暴露于空气污染/噪音与疾病死亡率之间的关联"
| 项目 | PM2.5 | PM10 | NO2 | NOx | 噪音 |
|---|---|---|---|---|---|
| HR(95%CI) | HR(95%CI) | HR(95%CI) | HR(95%CI) | HR(95%CI) | |
| 全因死亡率 | 1.06(1.05 ~ 1.07) | 1.01(1.01 ~ 1.02) | 1.01(1.01 ~ 1.01) | 1.00(1.00 ~ 1.00) | 1.00(1.00 ~ 1.01) |
| 癌症特异性死亡率 | 1.03(1.02 ~ 1.05) | 1.01(1.00 ~ 1.01) | 1.00(1.00 ~ 1.01) | 1.00(1.00 ~ 1.00) | 1.00(1.00 ~ 1.00) |
| 心血管疾病特异性死亡率 | 1.06(1.04 ~ 1.08) | 1.01(1.00 ~ 1.02) | 1.01(1.00 ~ 1.01) | 1.00(1.00 ~ 1.01) | 1.01(1.00 ~ 1.01) |
| 呼吸疾病特异性死亡率 | 1.15(1.11 ~ 1.20) | 1.05(1.02 ~ 1.07) | 1.02(1.01 ~ 1.02) | 1.01(1.01 ~ 1.01) | 1.01(1.00 ~ 1.02) |
表5
协变量多重插补后EPS/TDI与疾病死亡率之间的关联"
| 项目 | EPS | TDI | ||
|---|---|---|---|---|
| HR(95%CI) | P值 | HR(95%CI) | P值 | |
| 全因死亡率 | ||||
| 第1五分位组 | 1(Ref) | < 0.001 | 1(Ref) | < 0.001 |
| 第2五分位组 | 1.04(1.01 ~ 1.07) | 1.03(0.99 ~ 1.06) | ||
| 第3五分位组 | 1.09(1.05 ~ 1.13) | 1.06(1.03 ~ 1.10) | ||
| 第4五分位组 | 1.14(1.10 ~ 1.17) | 1.16(1.12 ~ 1.20) | ||
| 第5五分位组 | 1.20(1.16 ~ 1.24) | 1.39(1.34 ~ 1.43) | ||
| 癌症特异性死亡率 | ||||
| 第1五分位组 | 1(Ref) | < 0.001 | 1(Ref) | < 0.001 |
| 第2五分位组 | 1.04(0.99 ~ 1.09) | 1.04(0.99 ~ 1.09) | ||
| 第3五分位组 | 1.07(1.02 ~ 1.12) | 1.04(0.99 ~ 1.09) | ||
| 第4五分位组 | 1.08(1.03 ~ 1.13) | 1.07(1.02 ~ 1.12) | ||
| 第5五分位组 | 1.13(1.07 ~ 1.18) | 1.19(1.13-1.25) | ||
| 心血管疾病特异性死亡率 | ||||
| 第1五分位组 | 1(Ref) | < 0.001 | 1(Ref) | < 0.001 |
| 第2五分位组 | 1.04(0.97 ~ 1.12) | 0.99(0.91 ~ 1.07) | ||
| 第3五分位组 | 1.08(1.00 ~ 1.16) | 1.09(1.01 ~ 1.18) | ||
| 第4五分位组 | 1.16(1.08 ~ 1.25) | 1.22(1.13 ~ 1.32) | ||
| 第5五分位组 | 1.19(1.10 ~ 1.28) | 1.46(1.35 ~ 1.57) | ||
| 呼吸疾病特异性死亡率 | ||||
| 第1五分位组 | 1(Ref) | < 0.001 | 1(Ref) | < 0.001 |
| 第2五分位组 | 1.04(0.88 ~ 1.23) | 0.96(0.80 ~ 1.15) | ||
| 第3五分位组 | 1.30(1.11 ~ 1.52) | 1.10(0.92 ~ 1.31) | ||
| 第4五分位组 | 1.33(1.13 ~ 1.56) | 1.48(1.26 ~ 1.74) | ||
| 第5五分位组 | 1.54(1.32 ~ 1.80) | 2.08(1.78 ~ 2.43) | ||
表6
EPS、TDI与疾病死亡率之间的交互作用分析"
| TDI | EPS | 癌症特异性死亡率 | 心血管疾病特异性死亡率 | 呼吸疾病特异性死亡率 | 全因死亡率 | ||||
|---|---|---|---|---|---|---|---|---|---|
| HR(95%CI) | Pi 值 | HR(95%CI) | Pi 值 | HR(95%CI) | Pi 值 | HR(95%CI) | Pi 值 | ||
| 第1五分位组 | 第1五分位组 | 1(Ref) | < 0.05 | 1(Ref) | 0.31 | 1(Ref) | 0.17 | 1(Ref) | < 0.05 |
| 第2五分位组 | 1.07(0.97 ~ 1.19) | 1.07(0.90 ~ 1.27) | 0.64(0.43 ~ 0.96) | 0.99(0.91 ~ 1.07) | |||||
| 第3五分位组 | 1.03(0.92 ~ 1.15) | 0.91(0.75 ~ 1.11) | 0.65(0.42 ~ 1.02) | 1.08(0.98 ~ 1.19) | |||||
| 第4五分位组 | 1.07(0.94 ~ 1.23) | 1.01(0.80 ~ 1.28) | 0.85(0.51 ~ 1.41) | 1.03(0.90 ~ 1.18) | |||||
| 第5五分位组 | 0.99(0.82 ~ 1.20) | 0.91(0.65 ~ 1.27) | 1.33(0.74 ~ 2.37) | 1.03(0.96 ~ 1.11) | |||||
| 第2五分位组 | 第1五分位组 | 1(Ref) | 1(Ref) | 1(Ref) | 1(Ref) | ||||
| 第2五分位组 | 0.97(0.87 ~ 1.08) | 0.89(0.75 ~ 1.07) | 0.79(0.49 ~ 1.26) | 0.95(0.88 ~ 1.02) | |||||
| 第3五分位组 | 0.97(0.87 ~ 1.09) | 0.93(0.77 ~ 1.12) | 0.97(0.61 ~ 1.53) | 0.97(0.89 ~ 1.05) | |||||
| 第4五分位组 | 0.99(0.88 ~ 1.12) | 0.93(0.76 ~ 1.14) | 1.21(0.76 ~ 1.93) | 0.97(0.89 ~ 1.06) | |||||
| 第5五分位组 | 1.03(0.88 ~ 1.20) | 1.03(0.81 ~ 1.32) | 1.53(0.89 ~ 2.62) | 1.06(0.95 ~ 1.18) | |||||
| 第3五分位组 | 第1五分位组 | 1(Ref) | 1(Ref) | 1(Ref) | 1(Ref) | ||||
| 第2五分位组 | 0.93(0.82 ~ 1.06) | 0.99(0.81 ~ 1.20) | 0.64(0.40 ~ 1.03) | 0.94(0.85 ~ 1.02) | |||||
| 第3五分位组 | 1.03(0.91 ~ 1.16) | 1.00(0.82 ~ 1.22) | 0.76(0.49 ~ 1.18) | 1.00(0.92 ~ 1.09) | |||||
| 第4五分位组 | 1.14(1.01 ~ 1.29) | 1.01(0.83 ~ 1.23) | 0.98(0.65 ~ 1.48) | 1.08(0.99 ~ 1.18) | |||||
| 第5五分位组 | 1.3(1.13 ~ 1.48) | 0.86(0.68 ~ 1.09) | 0.64(0.38 ~ 1.10) | 1.1(1.00 ~ 1.21) | |||||
| 第4五分位组 | 第1五分位组 | 1(Ref) | 1(Ref) | 1(Ref) | 1(Ref) | ||||
| 第2五分位组 | 1.07(0.92 ~ 1.25) | 1.08(0.85 ~ 1.36) | 1.54(0.95 ~ 2.49) | 1.07(0.96 ~ 1.19) | |||||
| 第3五分位组 | 1.1(0.95 ~ 1.28) | 1.09(0.87 ~ 1.35) | 1.10(0.68 ~ 1.79) | 1.08(0.97 ~ 1.20) | |||||
| 第4五分位组 | 1.1(0.95 ~ 1.26) | 1.05(0.85 ~ 1.30) | 1.18(0.74 ~ 1.88) | 1.08(0.98 ~ 1.19) | |||||
| 第5五分位组 | 1.11(0.97 ~ 1.28) | 1.04(0.84 ~ 1.29) | 1.36(0.86 ~ 2.14) | 1.11(1.00 ~ 1.22) | |||||
| 第5五分位组 | 第1五分位组 | 1(Ref) | 1(Ref) | 1(Ref) | 1(Ref) | ||||
| 第2五分位组 | 1.01(0.82 ~ 1.25) | 0.85(0.63 ~ 1.15) | 1.77(0.94 ~ 3.34) | 1.05(0.91 ~ 1.21) | |||||
| 第3五分位组 | 0.97(0.80 ~ 1.18) | 1.12(0.85 ~ 1.48) | 2.03(1.11 ~ 3.72) | 1.16(1.01 ~ 1.32) | |||||
| 第4五分位组 | 1.00(0.83 ~ 1.21) | 0.94(0.71 ~ 1.23) | 1.64(0.90 ~ 2.99) | 1.07(0.94 ~ 1.22) | |||||
| 第5五分位组 | 1.00(0.83 ~ 1.19) | 0.98(0.76 ~ 1.27) | 1.45(0.81 ~ 2.62) | 1.07(0.94 ~ 1.21) | |||||
| 1 | LIU S, LIM Y H, PEDERSEN M, et al. Long-term air pollution and road traffic noise exposure and COPD: The Danish Nurse Cohort[J]. Eur Respir J, 2021, 58(6):2004594. |
| 2 |
PAUL K C, HAAN M, MAYEDA E R, et al. Ambient Air Pollution, Noise, and Late-Life Cognitive Decline and Dementia Risk[J]. Annu Rev Public Health, 2019, 40: 203-220. doi:10.1146/annurev-publhealth-040218-044058
doi: 10.1146/annurev-publhealth-040218-044058 |
| 3 |
COHEN A J, BRAUER M, BURNETT R, et al. Estimates and 25-year trends of the global burden of disease attributable to ambient air pollution: An analysis of data from the Global Burden of Diseases Study 2015[J]. Lancet, 2017, 389(10082): 1907-1918. doi:10.1016/s0140-6736(17)30505-6
doi: 10.1016/s0140-6736(17)30505-6 |
| 4 |
LIU C, CHEN R, SERA F, et al. Ambient Particulate Air Pollution and Daily Mortality in 652 Cities[J]. N Engl J Med, 2019, 381(8): 705-715. doi:10.1056/nejmc1913285
doi: 10.1056/nejmc1913285 |
| 5 | 陈星宇,肖颖,林华亮,等. 广东省7个城市气态污染物与心血管疾病入院人数、住院费用和住院天数的关系[J]. 实用医学杂志,2025,41(2):278-287. |
| 6 |
BRAUER M, CASADEI B, HARRINGTON R A, et al. Taking a stand against air pollution-The impact on cardiovascular disease[J]. Eur Heart J, 2021, 42(15): 1460-1463. doi:10.1093/eurheartj/ehaa1025
doi: 10.1093/eurheartj/ehaa1025 |
| 7 |
PYKO A, ROSWALL N, OGREN M, et al. Long-Term Exposure to Transportation Noise and Ischemic Heart Disease: A Pooled Analysis of Nine Scandinavian Cohorts[J]. Environ Health Perspect, 2023, 131(1): 17003. doi:10.1289/isee.2022.o-op-129
doi: 10.1289/isee.2022.o-op-129 |
| 8 |
THACHER J D, POULSEN A H, RAASCHOU-NIELSEN O, et al. Exposure to transportation noise and risk for cardiovascular disease in a nationwide cohort study from Denmark[J]. Environ Res, 2022, 211: 113106. doi:10.1016/j.envres.2022.113106
doi: 10.1016/j.envres.2022.113106 |
| 9 | LIM S S, VOS T, FLAXMAN A D, et al. A comparative risk assessment of burden of disease and injury attributable to 67 risk factors and risk factor clusters in 21 regions, 1990-2010: A systematic analysis for the Global Burden of Disease Study 2010[J]. Lancet, 2012, 380(9859): 2224-2260. |
| 10 | MUNZEL T, SORENSEN M, GORI T, et al. Environmental stressors and cardio-metabolic disease: Part I-epidemiologic evidence supporting a role for noise and air pollution and effects of mitigation strategies[J]. Eur Heart J, 2017, 38(8): 550-556. |
| 11 |
KALSCH H, HENNIG F, MOEBUS S, et al. Are air pollution and traffic noise independently associated with atherosclerosis: The Heinz Nixdorf Recall Study[J]. Eur Heart J, 2014, 35(13): 853-860. doi:10.1093/eurheartj/eht426
doi: 10.1093/eurheartj/eht426 |
| 12 |
FULLER R, LANDRIGAN P J, BALAKRISHNAN K, et al. Pollution and health: A progress update[J]. Lancet Planet Health, 2022, 6(6): e535-e547. doi:10.1016/s2542-5196(22)00090-0
doi: 10.1016/s2542-5196(22)00090-0 |
| 13 |
MARMOT M. Health equity in England:The Marmot review 10 years on[J]. BMJ, 2020,368:m693. doi:10.1136/bmj.m693
doi: 10.1136/bmj.m693 |
| 14 |
NEUMAYER E, PLUMPER T. Inequalities of Income and Inequalities of Longevity: A Cross-Country Study[J]. Am J Public Health, 2016, 106(1): 160-165. doi:10.2105/ajph.2015.302849
doi: 10.2105/ajph.2015.302849 |
| 15 |
STRINGHINI S, CARMELI C, JOKELA M, et al. Socioeconomic status and the 25×25 risk factors as determinants of premature mortality:A multicohort study and meta-analysis of 1.7 million men and women[J]. Lancet, 2017, 389(10075): 1229-1237. doi:10.1016/s0140-6736(16)32380-7
doi: 10.1016/s0140-6736(16)32380-7 |
| 16 |
ZHU Y, WANG Y, SHRIKANT B, et al. Socioeconomic disparity in mortality and the burden of cardiovascular disease: Analysis of the Prospective Urban Rural Epidemiology(PURE)-China cohort study[J]. Lancet Public Health, 2023, 8(12): e968-e977. doi:10.1016/s2468-2667(23)00244-x
doi: 10.1016/s2468-2667(23)00244-x |
| 17 |
SCHULTZ W M, KELLI H M, LISKO J C, et al. Socioeconomic Status and Cardiovascular Outcomes: Challenges and Interventions[J]. Circulation, 2018, 137(20): 2166-2178. doi:10.1161/circulationaha.117.029652
doi: 10.1161/circulationaha.117.029652 |
| 18 |
TORBRAND C, WIGERTZ A, DREVIN L, et al. Socioeconomic factors and penile cancer risk and mortality; A population-based study[J]. BJU Int, 2017, 119(2): 254-260. doi:10.1111/bju.13534
doi: 10.1111/bju.13534 |
| 19 |
LI W, RUAN W, PENG Y, et al. Associations of socioeconomic status and sleep disorder with depression among US adults[J]. J Affect Disord, 2021, 295: 21-27. doi:10.1016/j.jad.2021.08.009
doi: 10.1016/j.jad.2021.08.009 |
| 20 |
COLMER J, HARDMAN I, SHIMSHACK J, et al. Disparities in PM2.5 air pollution in the United States[J]. Science, 2020, 369(6503): 575-578. doi:10.1126/science.aaz9353
doi: 10.1126/science.aaz9353 |
| 21 |
SHEN Y, YAO L. PM2.5, Population Exposure and Economic Effects in Urban Agglomerations of China Using Ground-Based Monitoring Data[J]. Int J Environ Res Public Health, 2017, 14(7):716. doi:10.3390/ijerph14070716
doi: 10.3390/ijerph14070716 |
| 22 |
BRULLE R J, PELLOW D N. Environmental justice: Human health and environmental inequalities[J]. Annu Rev Public Health, 2006, 27: 103-124. doi:10.1146/annurev.publhealth.27.021405.102124
doi: 10.1146/annurev.publhealth.27.021405.102124 |
| 23 |
MILLER G, CHEN E, COLE S W. Health psychology: Developing biologically plausible models linking the social world and physical health[J]. Annu Rev Psychol, 2009, 60: 501-524. doi:10.1146/annurev.psych.60.110707.163551
doi: 10.1146/annurev.psych.60.110707.163551 |
| 24 |
HAJAT A, HSIA C, O'NEILL M S. Socioeconomic Disparities and Air Pollution Exposure: A Global Review[J]. Curr Environ Health Rep, 2015, 2(4): 440-450. doi:10.1007/s40572-015-0069-5
doi: 10.1007/s40572-015-0069-5 |
| 25 |
BOING A F, DESOUZA P, BOING A C, et al. Air Pollution, Socioeconomic Status, and Age-Specific Mortality Risk in the United States[J]. JAMA Netw Open, 2022, 5(5): e2213540. doi:10.1001/jamanetworkopen.2022.13540
doi: 10.1001/jamanetworkopen.2022.13540 |
| 26 |
JOSEY K P, DELANEY S W, WU X, et al. Air Pollution and Mortality at the Intersection of Race and Social Class[J]. N Engl J Med, 2023, 388(15): 1396-1404. doi:10.1056/nejmsa2300523
doi: 10.1056/nejmsa2300523 |
| 27 |
National academies of Sciences, Engineering, and Medicine; Division on Engineering and Physical sciences; Division on Earth and Life studies, et al. Advancing the Framework for Assessing Causality of Health and Welfare Effects to Inform National Ambient Air Quality Standard Reviews[M]. Washington (DC): National Academies Press (US), 2022. doi:10.17226/26612
doi: 10.17226/26612 |
| 28 |
BYCROFT C, FREEMAN C, PETKOVA D, et al. The UK Biobank resource with deep phenotyping and genomic data[J]. Nature, 2018, 562(7726): 203-209. doi:10.1038/s41586-018-0579-z
doi: 10.1038/s41586-018-0579-z |
| 29 |
KEPHALOPOULOS S, PAVIOTTI M, ANFOSSO-LEDEE F, et al. Advances in the development of common noise assessment methods in Europe: The CNOSSOS-EU framework for strategic environmental noise mapping[J]. Sci Total Environ, 2014, 482-483: 400-410. doi:10.1016/j.scitotenv.2014.02.031
doi: 10.1016/j.scitotenv.2014.02.031 |
| 30 |
FURLONG M A, KLIMENTIDIS Y C. Associations of air pollution with obesity and body fat percentage, and modification by polygenic risk score for BMI in the UK Biobank[J]. Environ Res, 2020, 185: 109364. doi:10.1016/j.envres.2020.109364
doi: 10.1016/j.envres.2020.109364 |
| 31 |
TOWNSEND P. Deprivation[J]. J Soc Policy, 1987, 16(2): 125-146. doi:10.1017/s0047279400020341
doi: 10.1017/s0047279400020341 |
| 32 |
BORRELL L N, ECHEVERRIA S E. The clustering effects of current smoking status, overweight/obesity, and physical inactivity with all-cause and cause-specific mortality risks in U.S. adults[J]. Prev Med Rep, 2024, 42: 102742. doi:10.1016/j.pmedr.2024.102742
doi: 10.1016/j.pmedr.2024.102742 |
| 33 |
SUN C, LI J, ZHAO Z, et al. The correlation between fruit intake and all-cause mortality in hypertensive patients: A 10-year follow-up study[J]. Front Nutr, 2024, 11: 1363574. doi:10.3389/fnut.2024.1363574
doi: 10.3389/fnut.2024.1363574 |
| 34 |
COLLABORATORS I C. Effects of education on adult mortality: A global systematic review and meta-analysis[J]. Lancet Public Health, 2024, 9(3): e155-e165. doi:10.1016/s2468-2667(23)00306-7
doi: 10.1016/s2468-2667(23)00306-7 |
| 35 |
CLOUGHERTY J E, HUMPHREY J L, KINNEE E J, et al. What Is "Socioeconomic Position(SEP)," and How Might It Modify Air Pollution-Health Associations? Cohering Findings, Identifying Challenges, and Disentangling Effects of SEP and Race in US City Settings[J]. Curr Environ Health Rep, 2022, 9(3): 355-365. doi:10.1007/s40572-022-00359-3
doi: 10.1007/s40572-022-00359-3 |
| [1] | 姚仁玲,朱艺璇,黄睿,李婕. 维生素摄入量与代谢相关脂肪性肝病进程的相关性分析[J]. 实用医学杂志, 2024, 40(6): 820-826. |
| [2] | 宋叶平 王丽玲 郭莎莎 董青 李焰生 糜建华 . 新型冠状病毒肺炎流行高峰期神经内科急诊患者的特征 [J]. 实用医学杂志, 2021, 37(8): 974-978. |
| [3] | 文政伟, 张冠荣, 吴粤, 袁向东. 加速康复外科诊疗模式实践的效果及影响因素 [J]. 实用医学杂志, 2021, 37(11): 1499-1503. |
| [4] | 宋风华, 郑颖颖, 唐俊楠, 郭倩倩, 张建朝, 程梦蝶, 蒋丽珠, 王凯, 刘志煜, 柏岩, 张金盈, .
平均血小板体积/淋巴细胞比值与冠心病经皮冠状动脉介入治疗术后长期死亡率的关系:一项队列研究
[J]. 实用医学杂志, 2020, 36(24): 3353-3357. |
| 阅读次数 | ||||||
|
全文 |
|
|||||
|
摘要 |
|
|||||